
To collect real-time GPU telemetry, such as thermal metrics and memory utilization, from containerized workloads in a Kubernetes cluster and export them to a Prometheus database, which component is required?
Select an answer to reveal the explanation.
Short Explanation
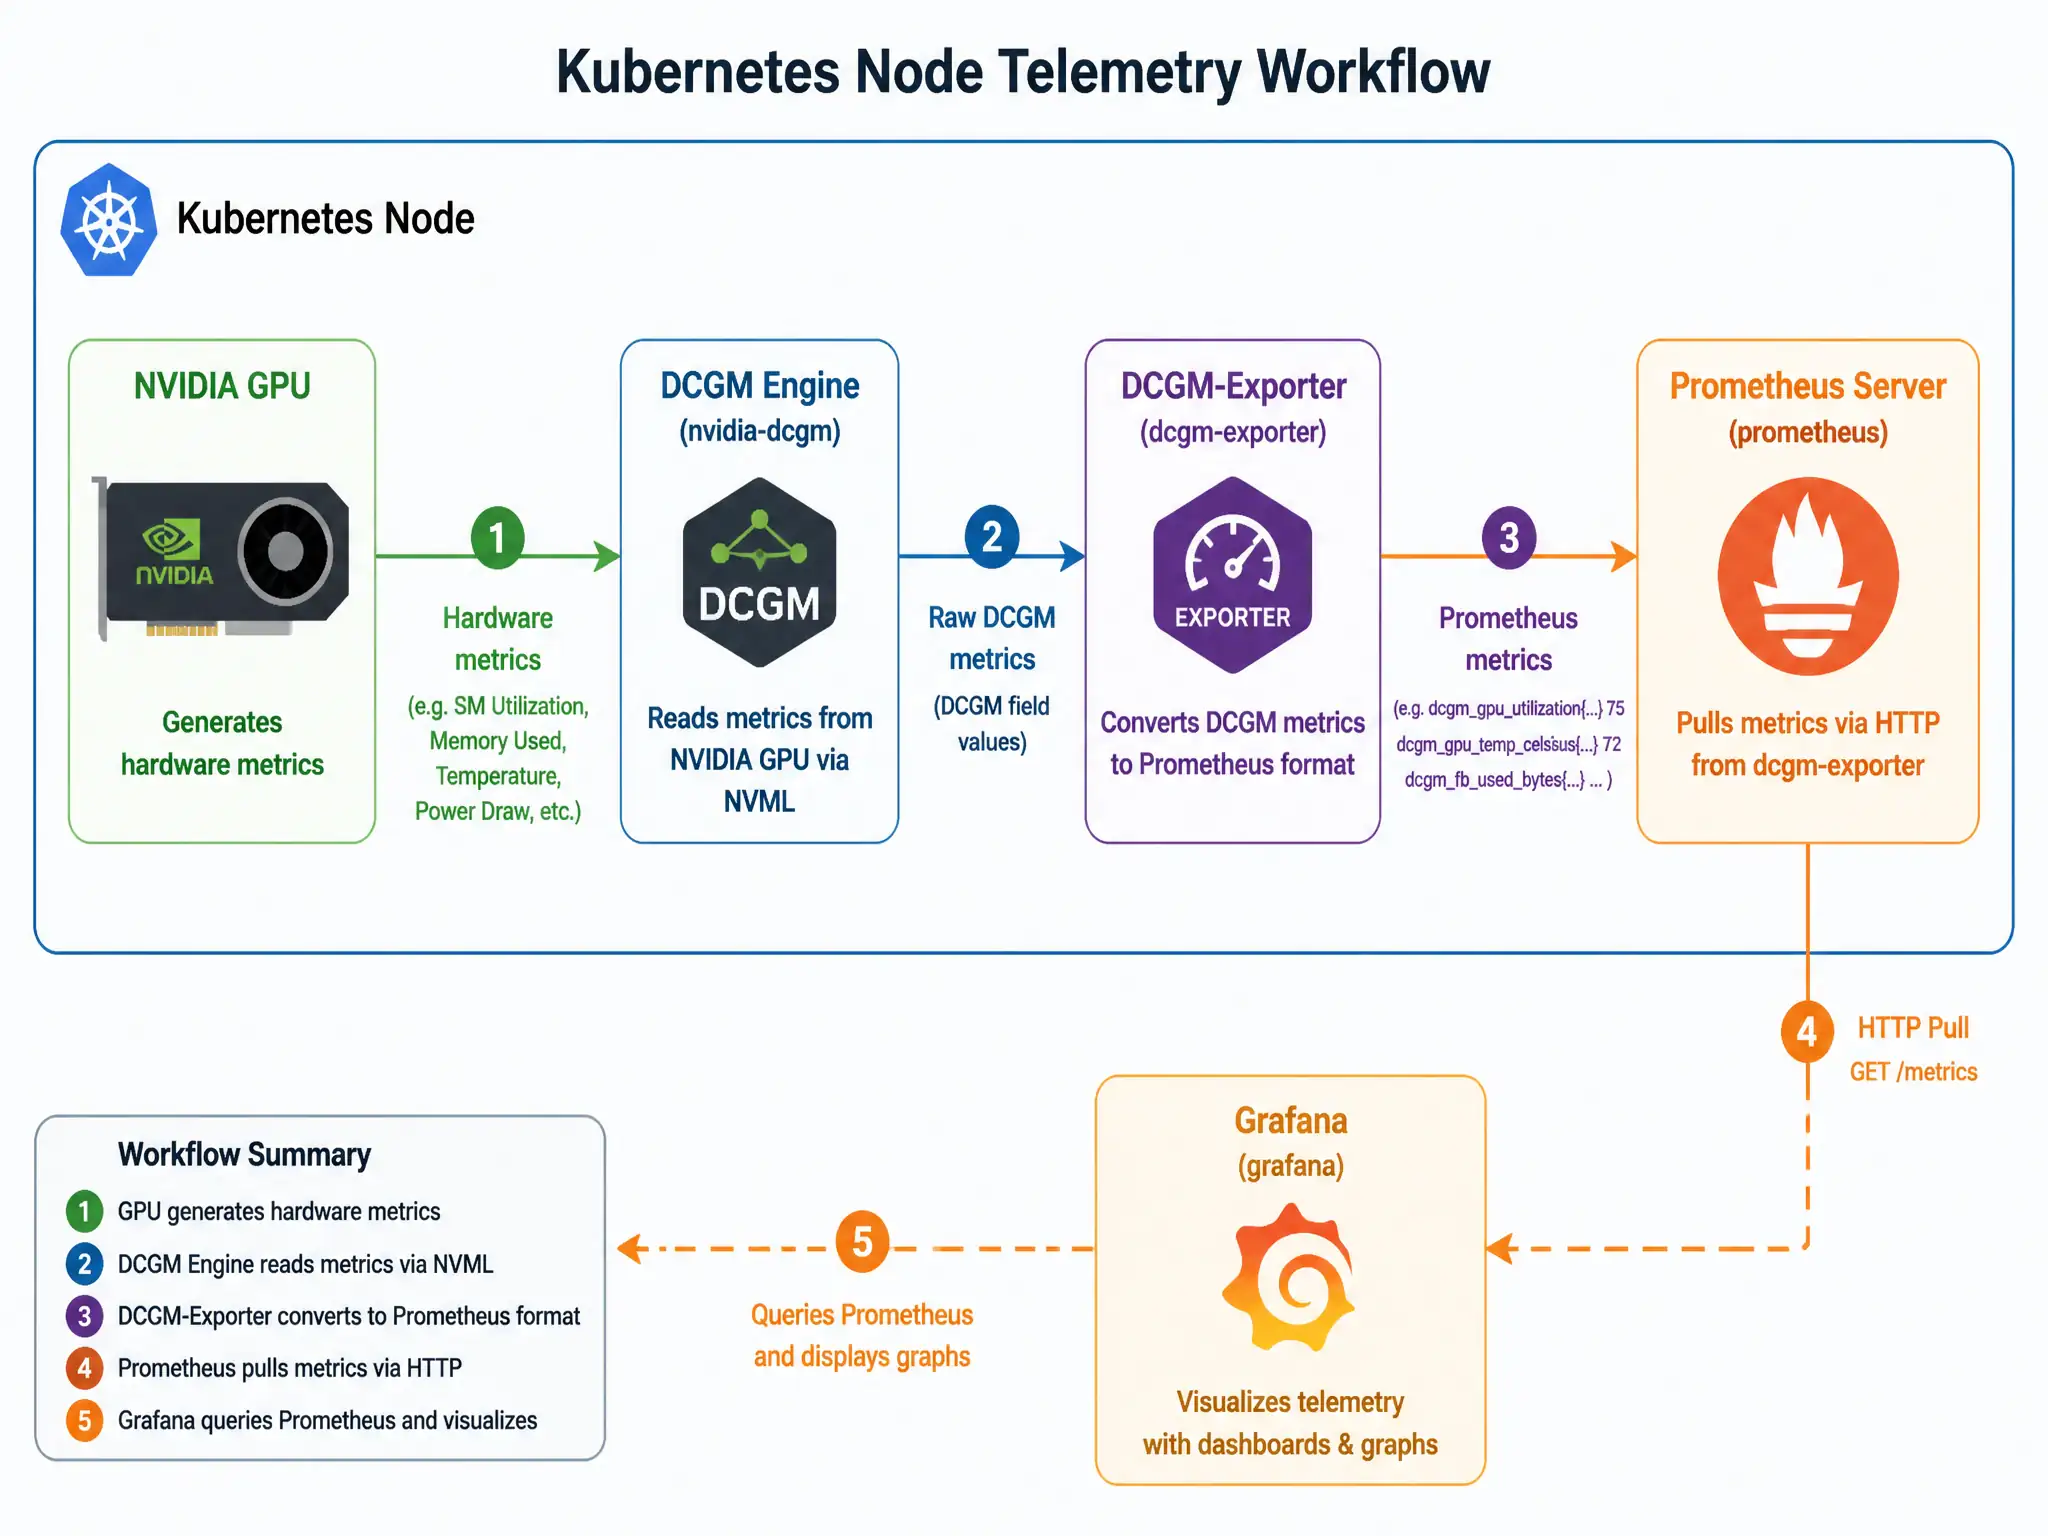
You can't manage what you don't measure. If you need real-time GPU telemetry from Kubernetes workloads and want it in Prometheus, you need the NVIDIA DCGM-Exporter to turn DCGM hardware stats into Prometheus-style metrics.
Full Explanation
In containerized Kubernetes environments, managing and monitoring hardware health requires exposing hardware telemetry to cluster-wide monitoring frameworks like Prometheus and Grafana. The NVIDIA DCGM-Exporter is the component that does this: it uses the NVIDIA Data Center GPU Manager (DCGM) engine under the hood, collects low-level GPU metrics such as SM utilization, memory usage, temperature, and performance throttle reasons, and exposes them through an HTTP endpoint in a Prometheus-compatible text format. The NVIDIA GPU Operator option is not the correct answer because it is a meta-operator that automates deployment of NVIDIA software components in Kubernetes, including drivers, device plugins, and the DCGM-Exporter itself, but it is not the specific telemetry exporter component. The NVIDIA Device Plugin option is wrong because it lets Kubernetes recognize and schedule physical GPUs to container pods, but it does not export metrics. The NVIDIA MIG Manager option is also wrong because it partitions physical GPUs into smaller virtual instances and manages their lifecycle, not telemetry export.