
A data science team needs to share the insights from a GPU-accelerated predictive model with non-technical business executives. To ensure the stakeholders can dynamically explore the results, zoom in on data points, and interact with the charts directly in their web browsers, the team must choose the right visualization frameworks. Which of the following tools should the team select to deliver these interactive, web-compatible visualizations? (Choose two)
Select all correct answers, then click Submit.
Short Explanation
Here's the deal: if you want business execs to explore results in their browsers, you need interactive web tools, not flat images. Plotly gives you responsive charts you can embed or share as HTML, and D3.js lets you build custom web visualizations from the ground up. Use those, and your stakeholders can actually poke at the data instead of staring at a dead chart.
Full Explanation
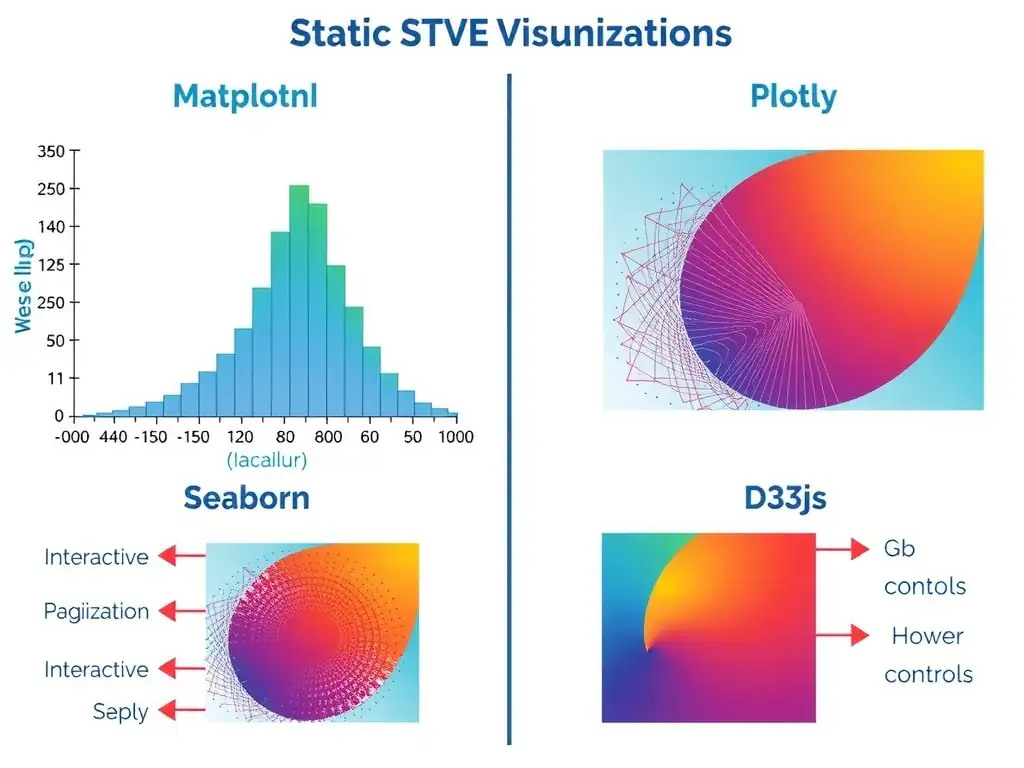
When presenting data analysis and machine learning model insights to non-technical stakeholders, the choice of visualization tools directly impacts how effectively the findings are communicated. For this target audience, interactive, web-based visualizations are preferred because they allow users to explore datasets dynamically through actions like panning, zooming, filtering, and hovering.
Plotly is a high-level charting library available in Python, R, and JavaScript. It is designed to generate interactive, web-ready graphs such as scatter plots, heatmaps, and three-dimensional plots out of the box. Because Plotly renders charts using WebGL and D3.js, it can handle large datasets and output standalone interactive HTML files or integrate seamlessly into web dashboards such as Dash or Streamlit.
D3.js, short for Data-Driven Documents, is a powerful, low-level JavaScript library used to bind arbitrary data to the Document Object Model and apply document-driven transformations. It allows developers to build highly customized, responsive, and complex interactive graphics from scratch. It is the industry standard for bespoke web-based interactive data storytelling.
The other tools do not meet the requirements. Seaborn is incorrect because it generates high-fidelity static statistical graphics that compile into local PDF reports, and its output formats such as PNG or PDF do not support the user-driven interactivity required for this scenario. Matplotlib is incorrect because it constructs traditional static plots embedded directly into local Python console outputs; while highly valuable for exploratory data analysis and academic publications, it produces static plots rather than browser-based interactive charts. TensorBoard is incorrect because it is a specialized developer dashboard designed to monitor and debug machine learning training sessions, publishing real-time telemetry such as learning rates, validation loss, training losses, gradient distributions, and weights. It is not designed to create consumer-facing business reports or general-purpose data visualizations for external stakeholders.
Therefore, Plotly and D3.js are the correct tools for interactive web visualizations.