
During the training phase of a large deep learning model on a cloud server equipped with NVIDIA GPUs, the execution process intermittently halts with an Out-of-Memory (OOM) error. Interestingly, real-time monitoring tools report that the total allocated VRAM remains well below the maximum hardware limit when the crash occurs. Which of the following explains this anomaly, and how can it be resolved?
Select an answer to reveal the explanation.
Short Explanation
This is one of those nasty issues: you've got free VRAM on paper, but it's fragmented into non-contiguous holes. Enable NVIDIA Unified Memory to let the driver migrate pages and map a larger managed address space. Trust me, it's a lifesaver.
Full Explanation
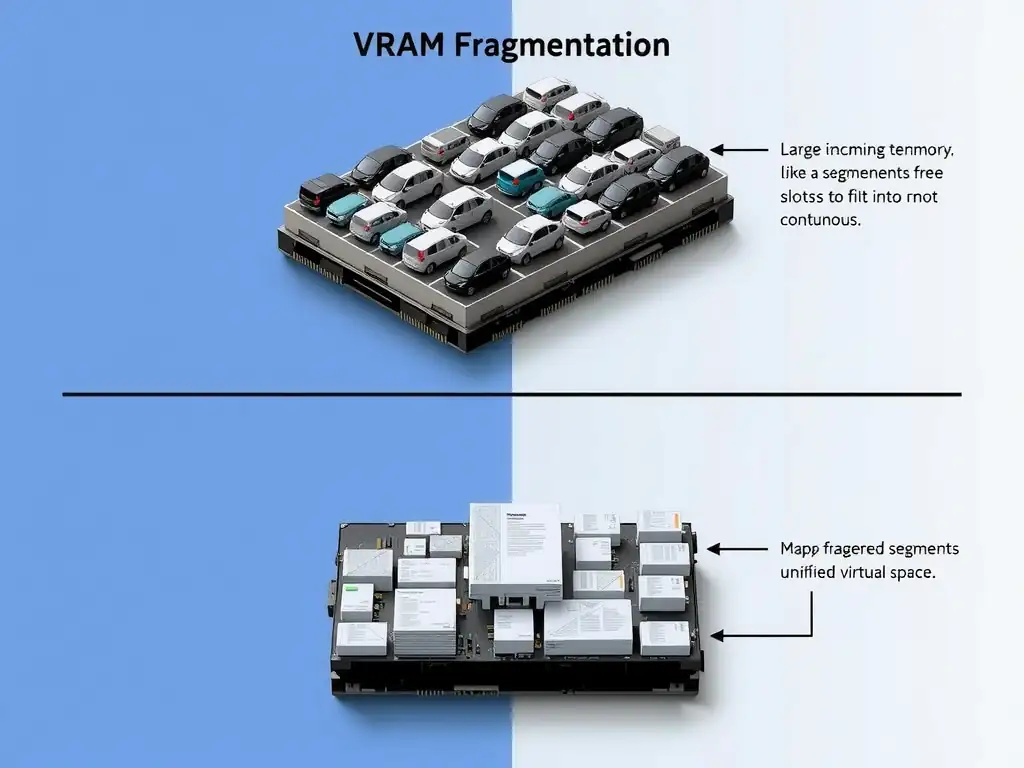
GPU memory allocation requires contiguous blocks of physical memory (VRAM) to store tensors. During training, variables are constantly allocated and freed as layers execute their forward and backward passes. Over time, this dynamic allocation causes memory fragmentation: the VRAM becomes peppered with small, non-contiguous free spaces. While the total sum of these free spaces might show as significant in monitoring tools such as nvidia-smi, a request for a large new tensor allocation will fail if there is no single contiguous block large enough to fit it. That's why monitoring can show total allocated VRAM well below the hardware limit while the allocation still fails, triggering an Out-of-Memory error.
To mitigate this, enabling NVIDIA Unified Memory, also known as CUDA Unified Memory, provides a bridge. Unified Memory creates a single, managed memory address space shared between the CPU and the GPU. It uses page migration engine technology to automatically move data pages between host system RAM and GPU VRAM on-demand. This allows applications to allocate memory larger than the physical size of VRAM, called oversubscription, and significantly reduces the impact of fragmentation by allowing the virtual memory system to map non-contiguous physical pages into a contiguous virtual address space.
The claim that the data loader is sending batches too slowly and that increasing worker threads will fix it is wrong because it causes GPU starvation and underutilization, which slows training but does not trigger Out-of-Memory crashes. The claim that the training batch size exceeds the physical GPU memory capacity and that reducing the batch size parameter will fix it is a standard way to reduce overall memory footprint, but it does not directly solve this anomaly when the crash happens while reported memory is well below the maximum capacity. The claim that the host CPU is over-subscribing the GPU command queue and that allocating additional CPU cores will fix it might affect host-device synchronization latency, but it does not cause physical VRAM allocation failures on the device.