
Your operations team is managing a large cluster of GPUs running distributed training runs in parallel. If one of these cards bottlenecks, the whole training job crawls. To make sure you're getting peak performance and can spot hardware bottlenecks immediately, which two GPU metrics are most critical to monitor?
Select all correct answers, then click Submit.
Short Explanation
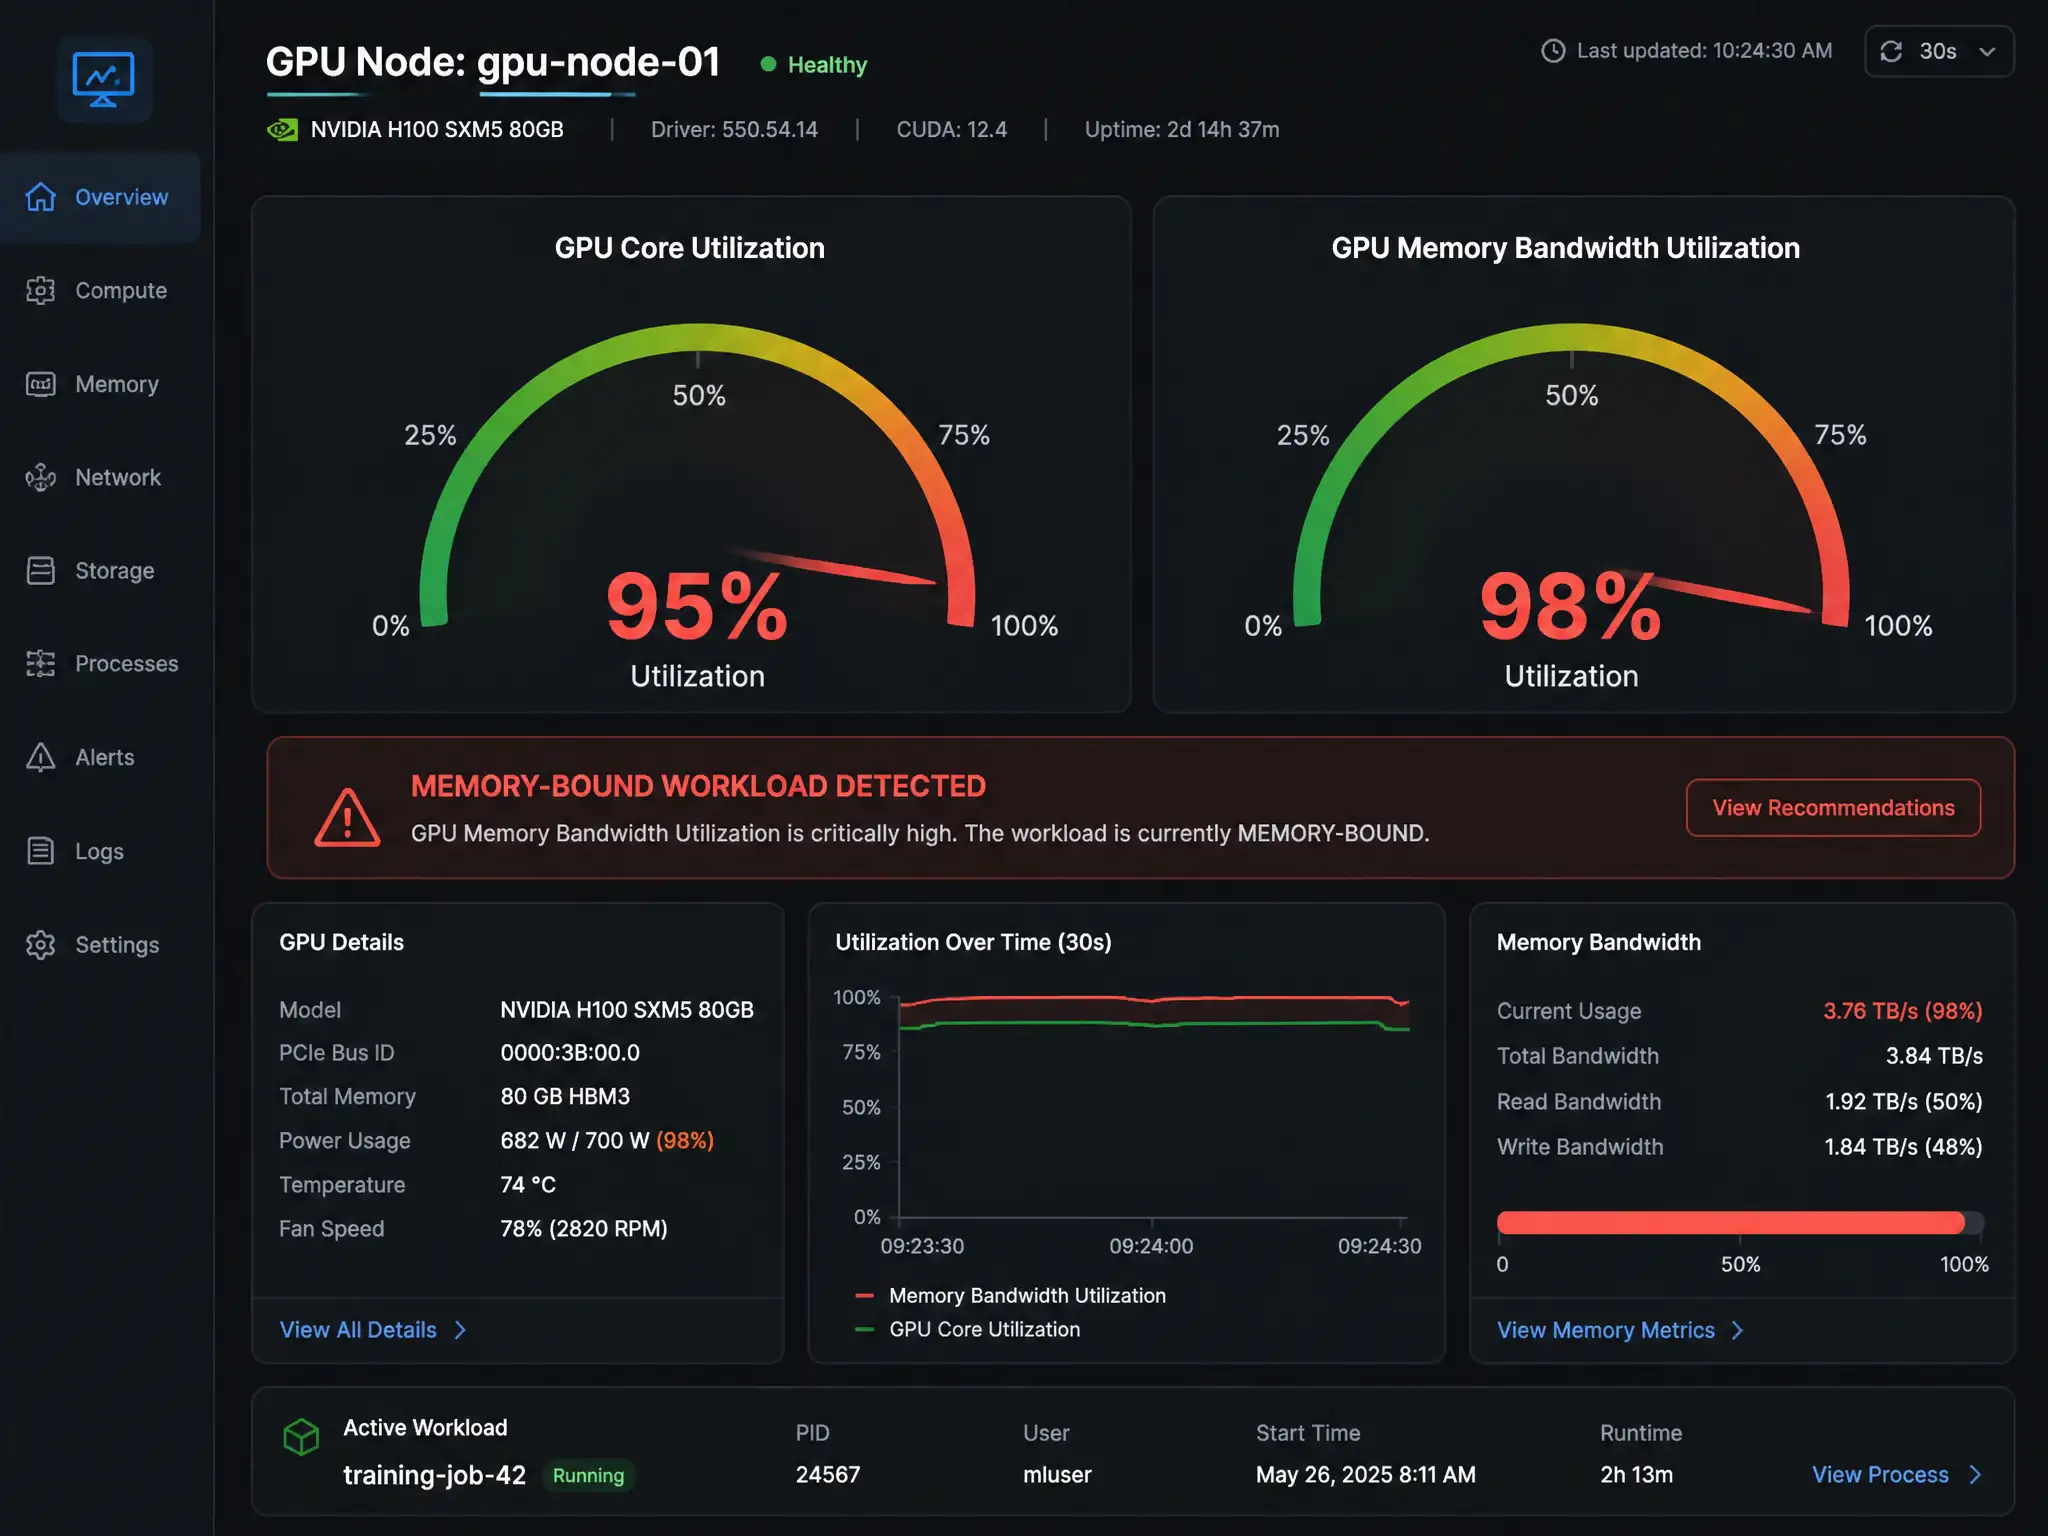
Okay, listen up: when your GPU cluster crawls, watch GPU core utilization percentage and GPU memory bandwidth utilization. Core utilization shows whether the cores are actually crunching, while memory bandwidth tells you whether they're starving for data from HBM. Monitor both to spot compute-bound or memory-bound bottlenecks fast.
Full Explanation
Efficient operations in a GPU-accelerated cluster require deep observability into hardware resource utilization. During parallel training workloads, a slowdown on a single GPU can impact the entire cluster due to synchronization barriers. Two primary metrics are essential for diagnosing these bottlenecks:
- GPU core utilization percentage represents the percentage of time during which one or more kernels were executing on the GPU cores. It indicates whether the GPU is active. However, core utilization alone can be misleading; low core utilization does not always mean the workload is light—it can indicate that the GPU is waiting for data. - GPU memory bandwidth utilization measures the throughput of data transfers between the GPU's High Bandwidth Memory (HBM) and the processing cores. Deep learning workloads, such as large matrix operations, require high volumes of data to be constantly read and written. When memory bandwidth utilization approaches 100%, the memory bus is saturated, and the execution cores must wait for data, creating a memory-bound bottleneck.
Analyzing the incorrect choices: - The host CPU thread count and context switching rate choice monitors the host CPU, which is secondary to the GPU's internal performance in accelerated computing workloads. - Physical acoustic fan noise levels in the server chassis, while related to heat dissipation and fan speed, do not provide computational performance telemetry. - Any choice that merely mentions fan noise, repeats the need to look at GPU utilization and memory bandwidth, or describes host CPU monitoring is not an independent GPU performance metric and cannot identify the bottleneck.
Monitoring both GPU core utilization and GPU memory bandwidth utilization allows operations teams to identify if a system is compute-bound, memory-bound, or network-starved, enabling precise infrastructure optimization.