An systems administrator is troubleshooting a performance bottleneck in an AI training cluster where deep learning jobs are executing much slower than expected. To determine if the bottleneck is related to GPU resource constraints, memory exhaustion, or thermal throttling, which log source or monitoring utility should they analyze first?
Select an answer to reveal the explanation.
Short Explanation and Infographic
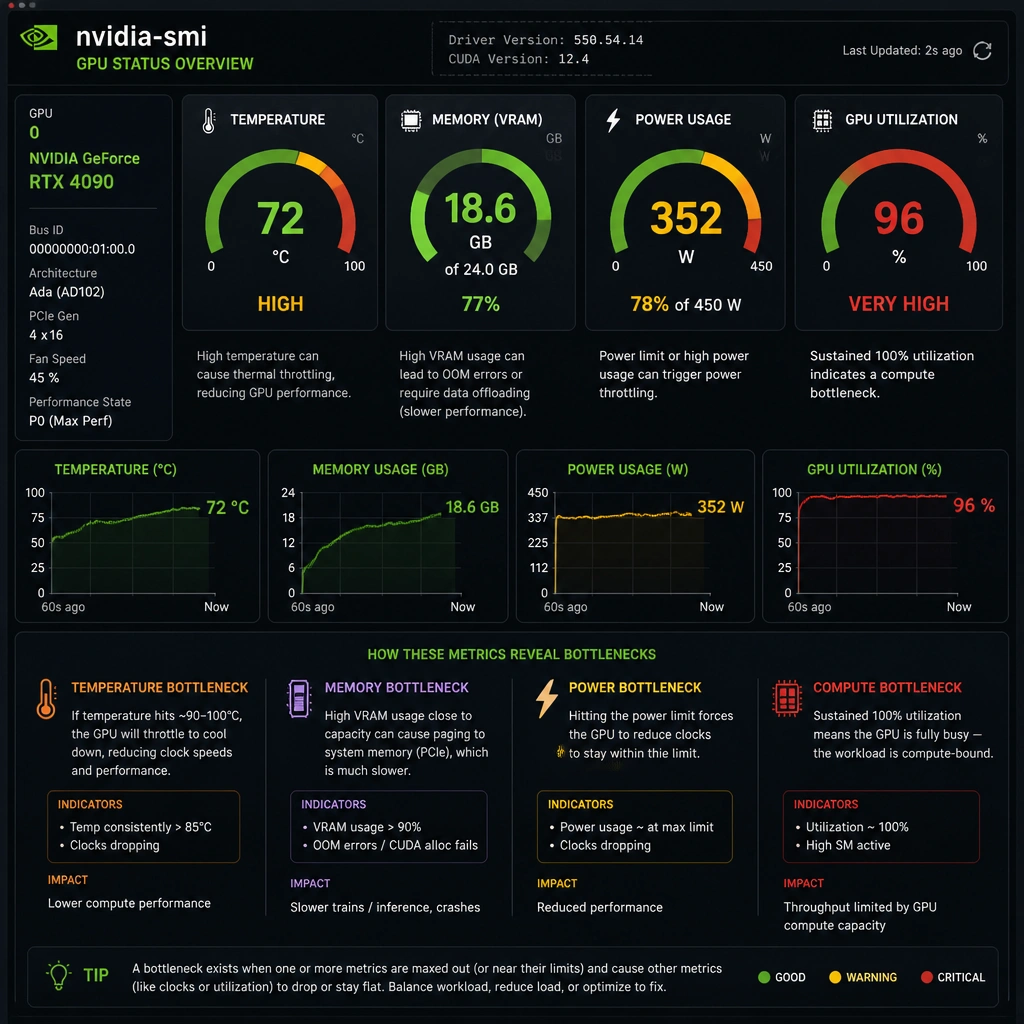
Check this out: when your deep learning training runs start crawling, you need to know exactly what's happening inside the GPU silicon. Are you running out of VRAM? Is the card overheating and thermal throttling? Or are your GPUs just sitting idle waiting for data to arrive from the CPU? You won't find those answers in standard system logs. You need to look at nvidia-smi. This is the NVIDIA System Management Interface, and it is your absolute go-to command for monitoring GPU health. It gives you real-time metrics on GPU utilization, memory usage, power draw, and temperature. If you run nvidia-smi and see that your GPU utilization is at 10% while your memory is at 99%, you know right away you've got a bottleneck. Relying on dmesg or network logs will just have you chasing ghosts.
Full explanation below image
Full Explanation
When diagnosing performance degradation in GPU-accelerated workloads, system administrators must monitor the physical and operational states of the GPU hardware. Bottlenecks in deep learning jobs are typically caused by memory allocation issues (e.g., out-of-memory errors), thermal throttling due to insufficient cooling, or low utilization due to data starvation from the CPU or storage. The NVIDIA System Management Interface (nvidia-smi) is a command-line utility based on the NVIDIA Management Library (NVML). It provides real-time monitoring and logging capabilities for NVIDIA Tesla, GRID, Quadro, and GeForce devices. The logs generated by nvidia-smi track critical metrics, including GPU utilization percentages, memory usage (VRAM allocation), temperature, fan speeds, power draw, and active compute processes. Analyzing these logs allows administrators to identify if the GPUs are fully utilized, if workloads are bottlenecked by memory capacity, or if power management limits are being hit. Let's examine the other options: Operating system kernel logs via dmesg (Option A) capture hardware-level events and driver crashes, but they do not provide continuous performance metrics like GPU utilization or memory usage. Application error logs (Option B) are useful for debugging software exceptions or code logic errors, but they do not give insight into real-time hardware performance or hardware-level bottlenecks. Network traffic logs (Option C) help diagnose communication issues between nodes in a distributed training setup but are not the primary source for diagnosing localized GPU performance constraints.