An operations team is establishing a monitoring dashboard for a cluster of NVIDIA DGX systems. To ensure that AI workloads are utilizing the hardware efficiently without running into bottlenecks, and to proactively prevent hardware damage from thermal overload, which two metrics should the team monitor on their dashboard? (Select two)
Select all correct answers, then click Submit.
Short Explanation and Infographic
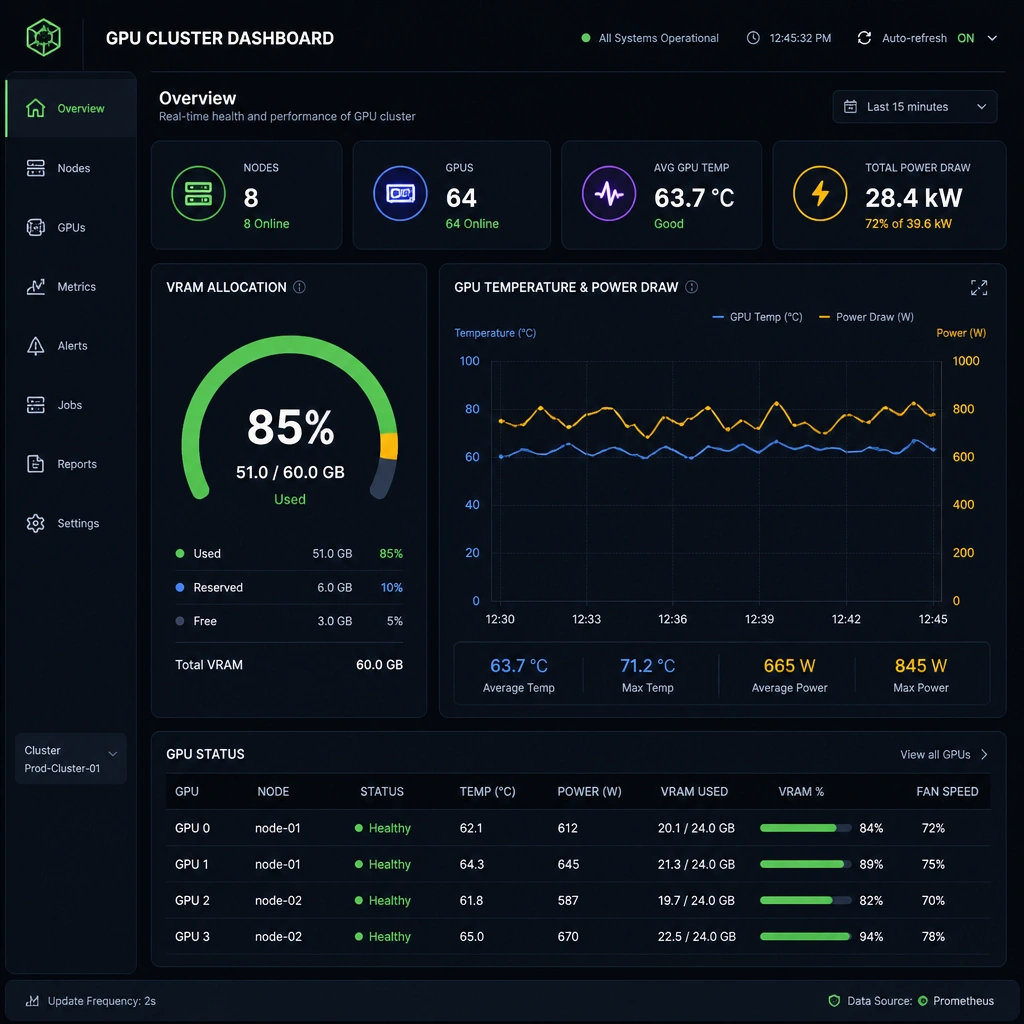
Okay, let's talk operations. You've got these high-end DGX systems running 24/7. They're basically high-performance furnaces when they're running under full load. If you don't monitor them, things can go south fast. First, you need to watch GPU temperature and power draw. If a fan fails or your data center cooling hiccups, those GPUs will heat up and start thermal throttling—or worse, suffer physical damage. Monitoring power consumption also tells you if the cards are running at their maximum capacity. Second, you've got to watch GPU memory utilization (VRAM). If your models are hitting the VRAM limit, they'll throw 'Out of Memory' (OOM) errors and crash your jobs, or start swapping to system RAM, which is incredibly slow. Keep these two metrics front and center on your dashboard, and you'll keep your cluster running cool and fast!
Full explanation below image
Full Explanation
Monitoring enterprise GPU clusters requires tracking both operational health (to prevent hardware damage) and performance efficiency (to avoid resource bottlenecks). The two most critical metrics for these purposes are: 1. GPU Temperature and Power Draw: GPUs consume significant amounts of electrical power and generate substantial heat under load. Monitoring temperature is vital to detect cooling failures and prevent thermal throttling (where the GPU automatically lowers its clock speed to cool down) or permanent hardware damage. Power consumption monitoring helps verify that GPUs are operating within their specified thermal design power (TDP) envelopes and are not being limited by power delivery constraints. 2. GPU Memory (VRAM) Utilization: The VRAM (or frame buffer) holds the model weights, active activation layers, and batch data during execution. Unlike CPU memory, if a GPU runs out of VRAM, the application cannot easily page to disk and will typically crash immediately with an 'Out of Memory' (OOM) error. High memory utilization indicates that the hardware is being used efficiently, but hitting the maximum limit requires adjusting batch sizes or distributing the model.
Let's evaluate the incorrect options: - Network interface packet drops and local SSD IOPS are general system infrastructure metrics. While they are useful for troubleshooting storage and network bottlenecks, they do not provide direct insight into GPU health or runtime memory utilization. - Host CPU clock speed measures CPU performance, which does not reflect the operational state or memory limits of the GPU accelerators.