
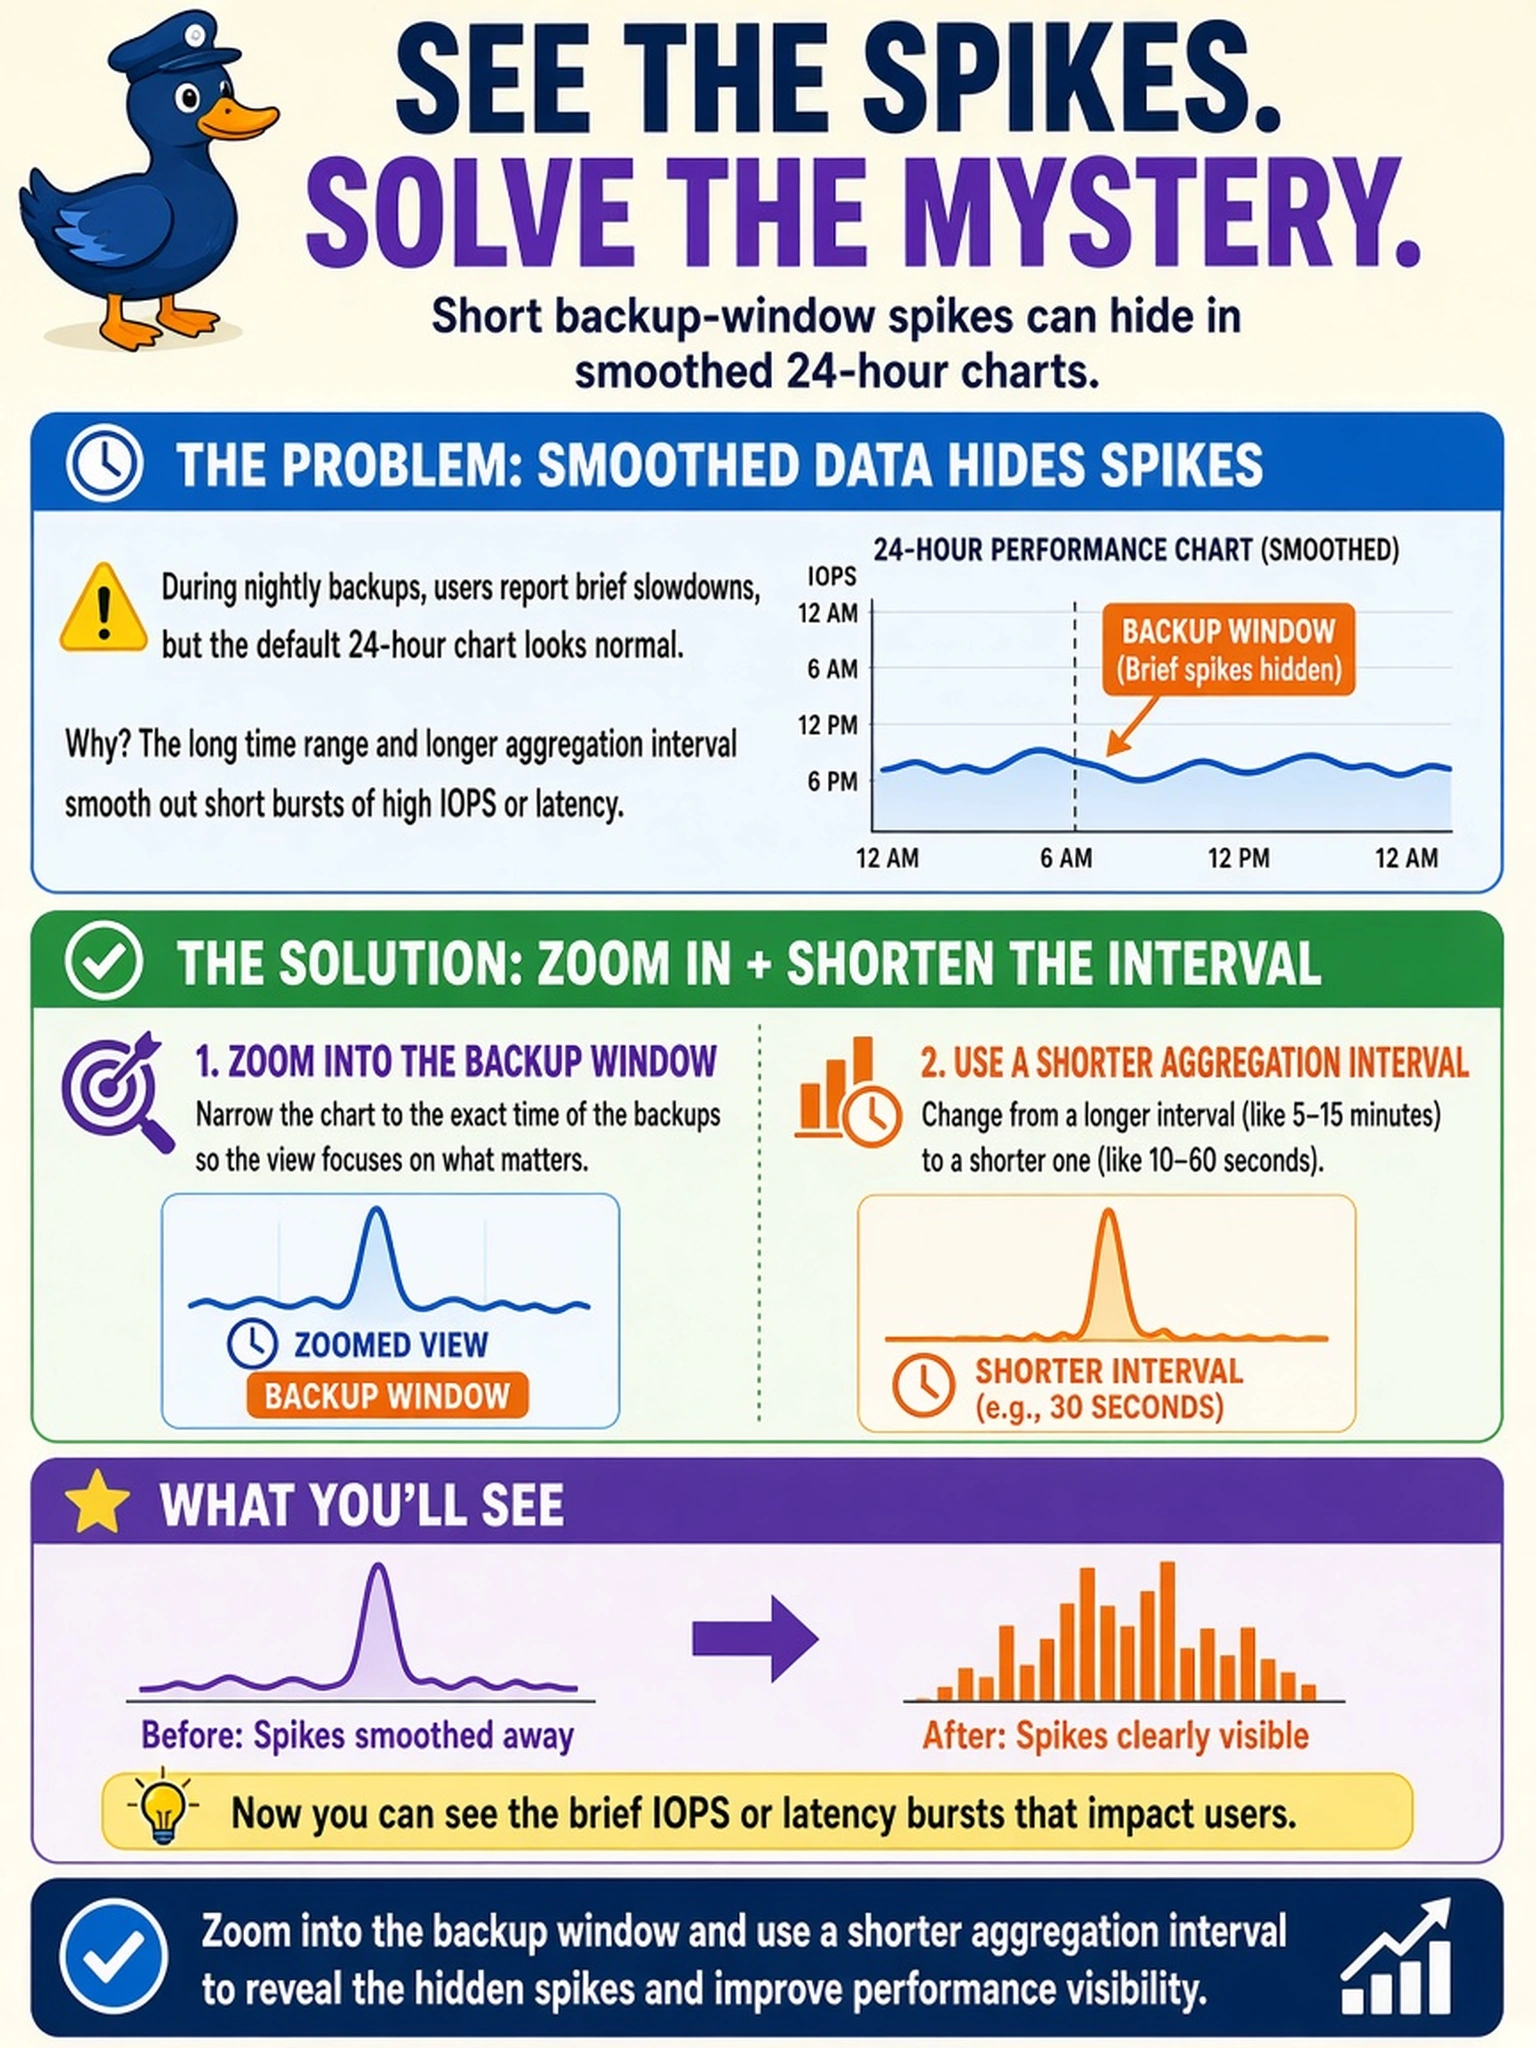
During nightly backups, a Prism Central performance chart shows no unusual IOPS or latency, yet users report brief slowdowns. The default 24-hour chart smooths the issue. What should you adjust to make the short backup-window spikes visible?
Select an answer to reveal the explanation.
Short Explanation
Think of performance charts like a video scrubber: if you zoom out to a whole day, a quick backup spike is just a blur. Narrow the window and pick a shorter aggregation interval to see the burst. Don't confuse keeping more history with actually seeing the moment it happened.
Full Explanation
Prism performance views sample metrics and aggregate them over a selected interval, so the chart's interval, not the data source, controls what you see. When a chart covers many hours, short bursts are averaged into nearby samples and can disappear; narrowing the time range around the backup window and selecting a shorter interval exposes transient IOPS and latency. Raising the metric retention period preserves historical data but does not change how the current chart aggregates samples, so a one-minute spike remains hidden if the view averages it. A 24-hour view with averaged CPU utilization emphasizes broad trends and can suppress transient storage or network noise rather than reveal it. Increasing alert thresholds may prevent notifications during the backup window, but it does not improve observability or help identify the root cause. Exam caveat: the key distinction is between data retention and display granularity; longer history does not equal finer visibility. Operational check: open the relevant VM or cluster performance chart, set the time range to the backup window, and reduce the aggregation interval until the spike is visible.