
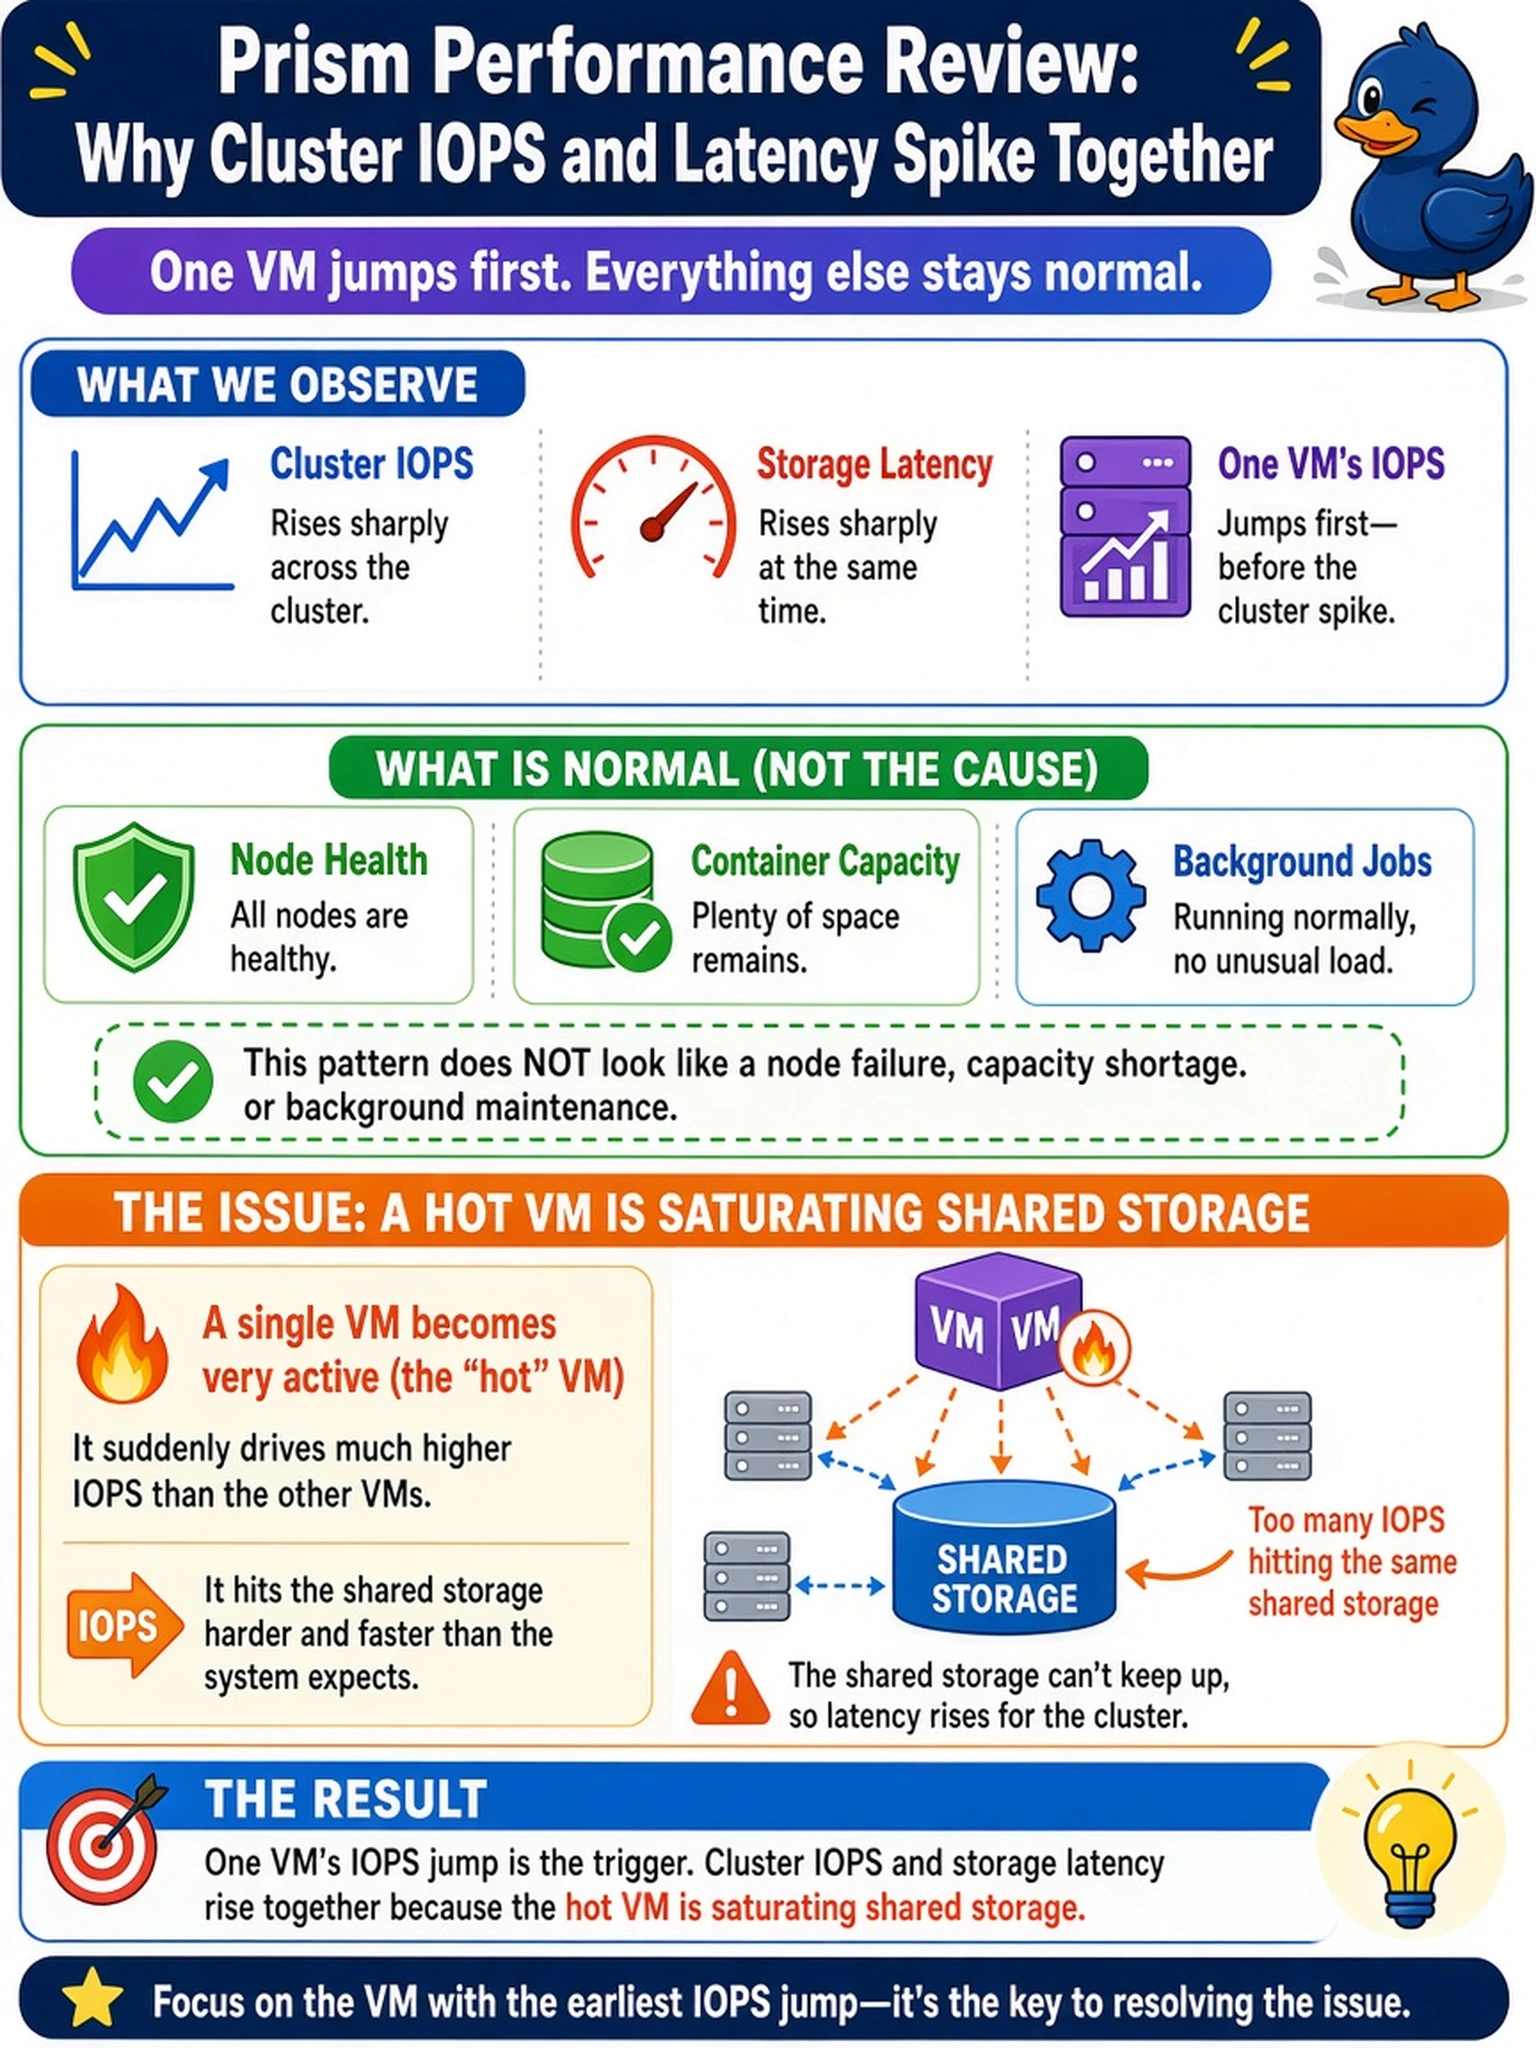
During a Prism performance review, you see cluster IOPS and storage latency rise sharply at the same time. A single VM’s IOPS graph jumps first, while node health, container capacity, and background jobs remain normal. Which issue best explains the pattern?
Select an answer to reveal the explanation.
Short Explanation
Think of a noisy VM like one guest hogging the elevator: everyone else waits when its IOPS spike climbs. You want the first graph that moved, not a background job you assumed was running. The trap is blaming capacity or maintenance when the hot workload is staring at you.
Full Explanation
The mechanism is concentrated guest I/O demand: when one workload’s read/write activity grows rapidly, its queue depth and storage latency can rise enough to pull cluster averages upward. In a distributed Nutanix cluster, extents are spread across nodes, yet a very active guest can still create a hot path on the nodes hosting its data, so the first signal often appears on that VM’s performance chart. That pattern points to workload behavior, not infrastructure failure. A container near capacity would show capacity or space-reclamation signals, and its impact would generally correlate with free-space thresholds or compaction rather than a single VM’s immediate IOPS curve. A failed CVM or node rebuild would add background rebuild traffic and usually be accompanied by node-down, CVM, or replication alerts, so the absence of those events makes it unlikely. A scheduled health or integrity scan would be visible as a background task and would not first appear as one VM’s guest IOPS spike. Exam caveat: choose the earliest and most specific monitoring signal, not the most dramatic platform event. Operational check: sort VM performance by IOPS and latency in Prism, confirm the VM’s working set and queue depth, and then throttle or migrate the guest if it is not an approved high-priority workload.