
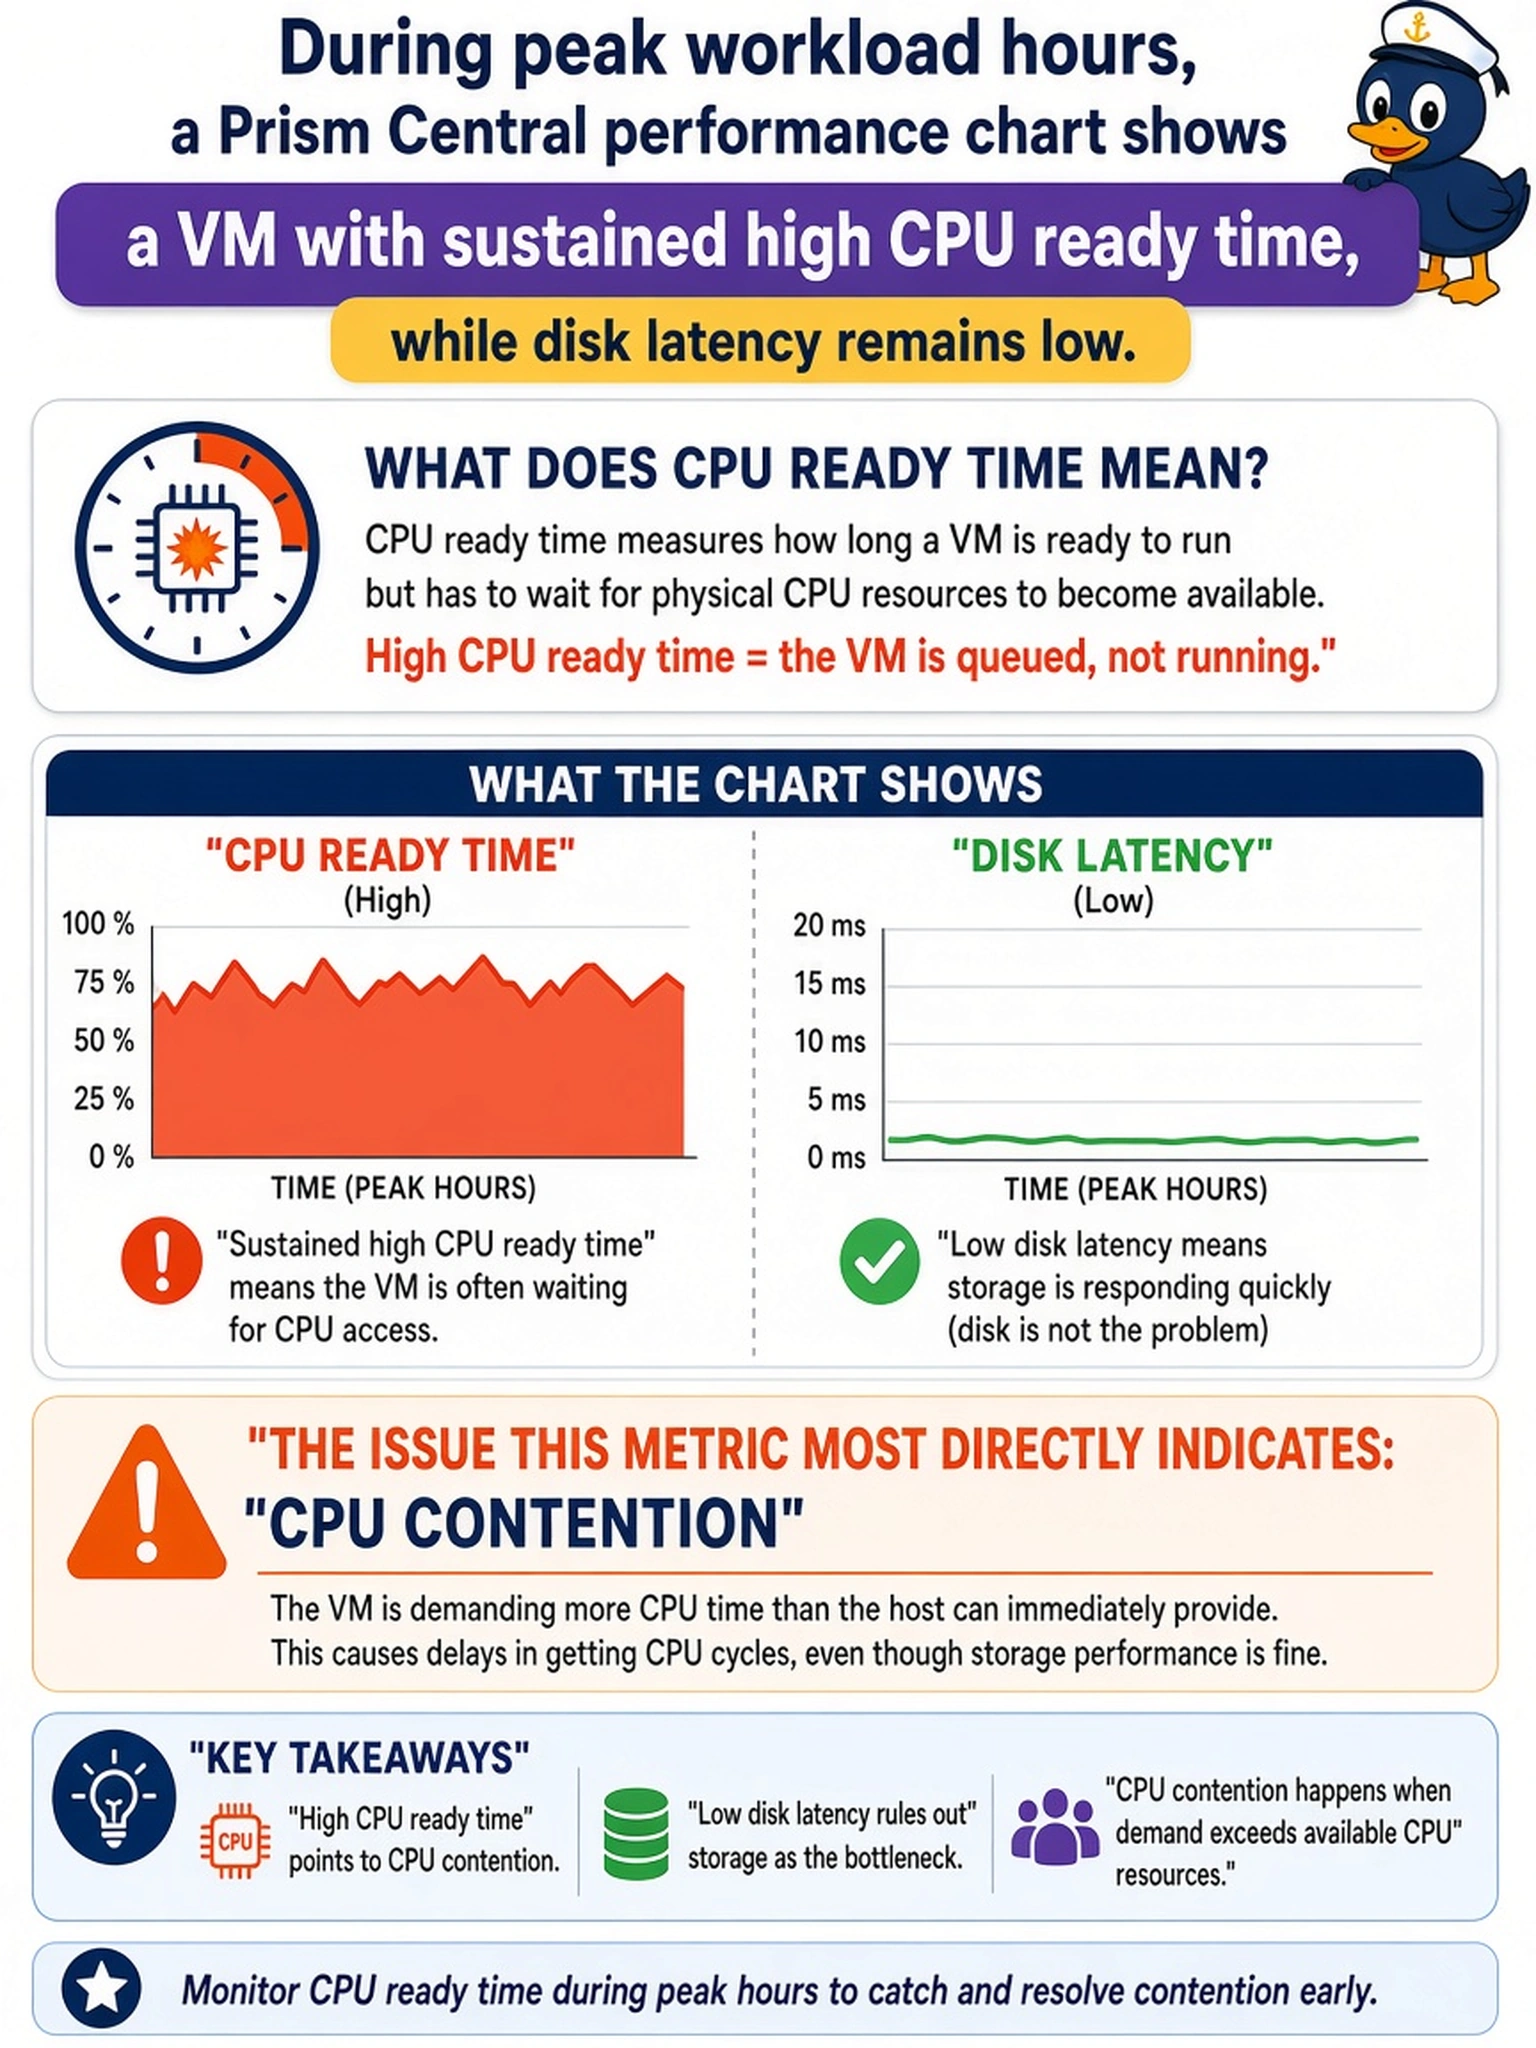
During peak workload hours, a Prism Central performance chart shows a VM with sustained high CPU ready time, while disk latency remains low. Which issue does this metric most directly indicate?
Select an answer to reveal the explanation.
Short Explanation
High CPU ready time is like your VM standing in line for a physical core. It means the hypervisor had CPU work waiting, not that disks were slow. You want to chase CPU contention first, not storage latency.
Full Explanation
CPU ready time measures how long a powered-on vCPU is ready to execute but is waiting for a physical CPU core to become available. When that metric climbs during peak workload hours while storage latency stays low, the most direct interpretation is CPU contention: the host or cluster cannot schedule the VM's vCPUs quickly enough. Administrators can confirm this by comparing CPU ready with host CPU utilization, checking vCPU overcommitment, and reviewing whether the VM is pinned, throttled, or competing with other workloads. Storage latency is wrong because it describes disk read/write response time, queue depth, or I/O wait, not scheduler wait for CPU. Memory pressure is wrong because it is indicated by ballooning, swapping, guest memory usage, or working-set behavior, not by vCPU scheduling delay. Network throughput is wrong because it reflects bits moved, packets dropped, or latency across a network path, and does not explain a vCPU waiting for a core. Exam caveat: high CPU ready points to CPU scheduling pressure, not storage latency, even when the workload is disk-heavy. Operational check: inspect the VM's CPU ready and host CPU utilization in Prism, then reduce vCPU overcommitment or migrate the VM if contention persists.