
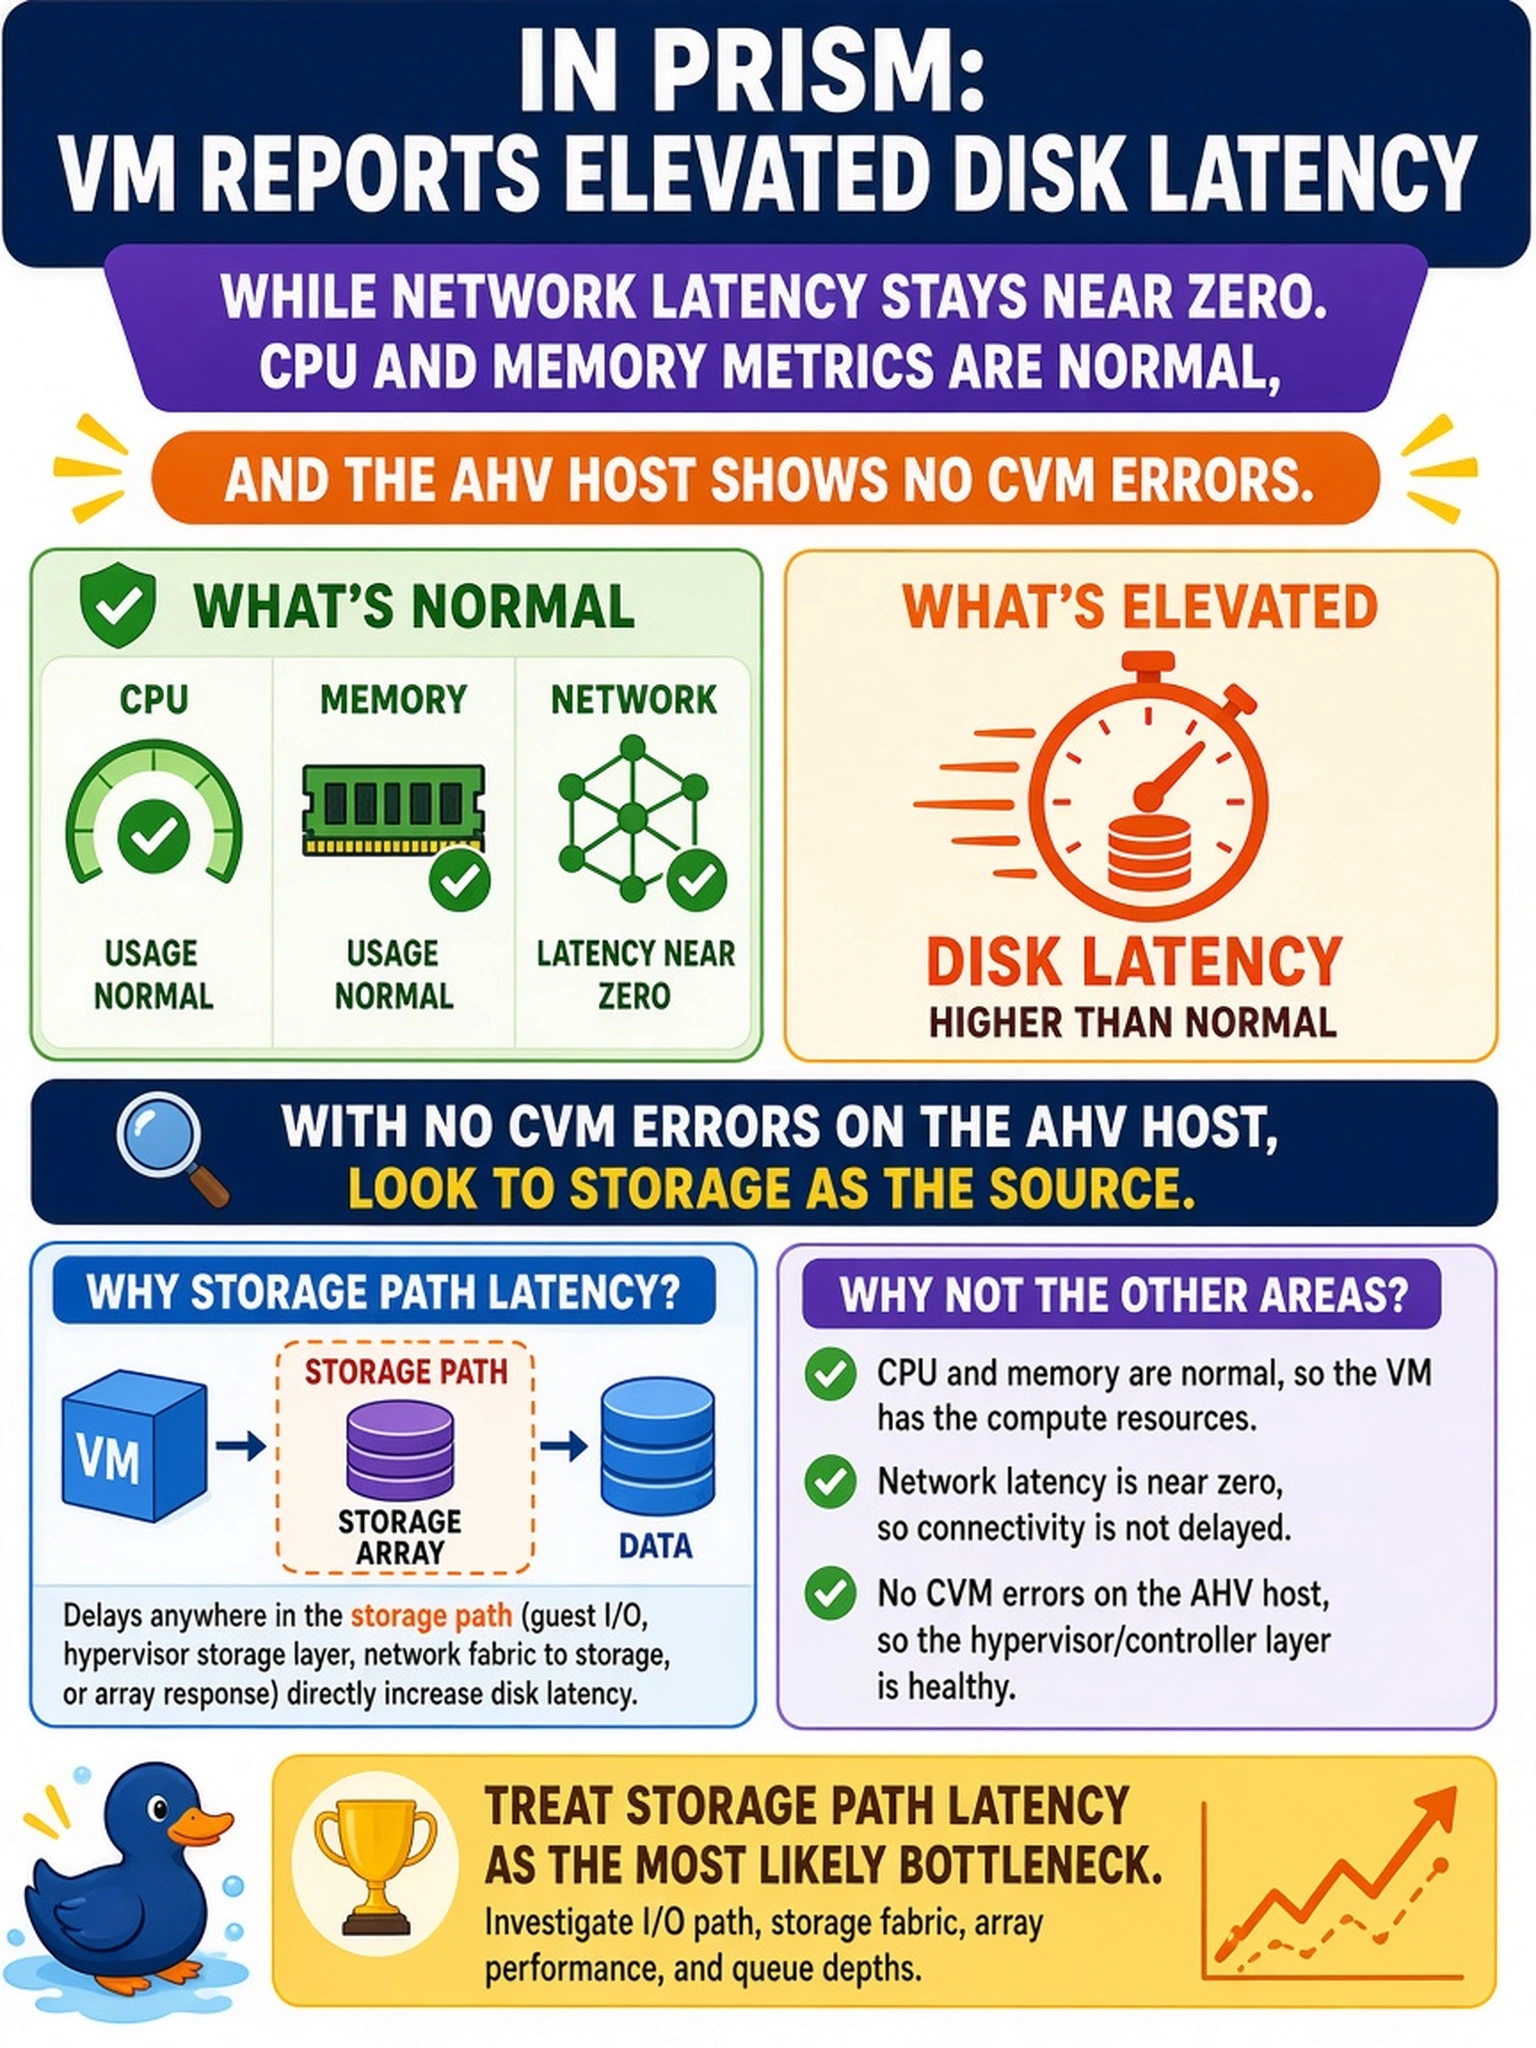
In Prism, a VM reports elevated disk latency while network latency stays near zero. CPU and memory metrics are normal, and the AHV host shows no CVM errors. What should an administrator treat as the most likely bottleneck?
Select an answer to reveal the explanation.
Short Explanation
Think of disk latency like a slow checkout lane while the parking lot is empty. If the network isn't congested, don't chase packets—look at the storage path first. That's where your bottleneck lives when only disk latency is climbing.
Full Explanation
Disk latency on a Nutanix VM reflects time spent in the I/O path from the guest block device through AHV, Stargate/CVM storage services, and the underlying container. When Prism shows disk latency elevated while network latency, CPU ready, and memory metrics remain normal, the most direct hypothesis is a storage-path bottleneck: queue depth, CVM disk servicing, container contention, tiering, or QoS settings. Nutanix monitoring is designed to isolate subsystems first, so the abnormal metric guides the next data point. Network congestion on an AHV bridge or bond is unlikely because the network latency metric is low and the observed delay is specifically disk I/O; a congested virtual network would raise network drop or latency counters rather than disk latency. CPU ready time caused by host oversubscription can make an application feel slow, but its primary evidence is CPU scheduling delay, not an isolated disk latency spike. Memory ballooning or guest memory pressure can trigger swapping and indirect I/O, but the scenario gives no memory-pressure signal, so storage remains the first place to look. Exam caveat: do not jump to moving a VM or raising QoS until Prism performance graphs separate disk, network, CPU, and memory metrics. Operational check: compare the VM's disk latency and IOPS against cluster CVM storage latency and queue depth, then review container, disk, and QoS data before changing networking or compute resources.