
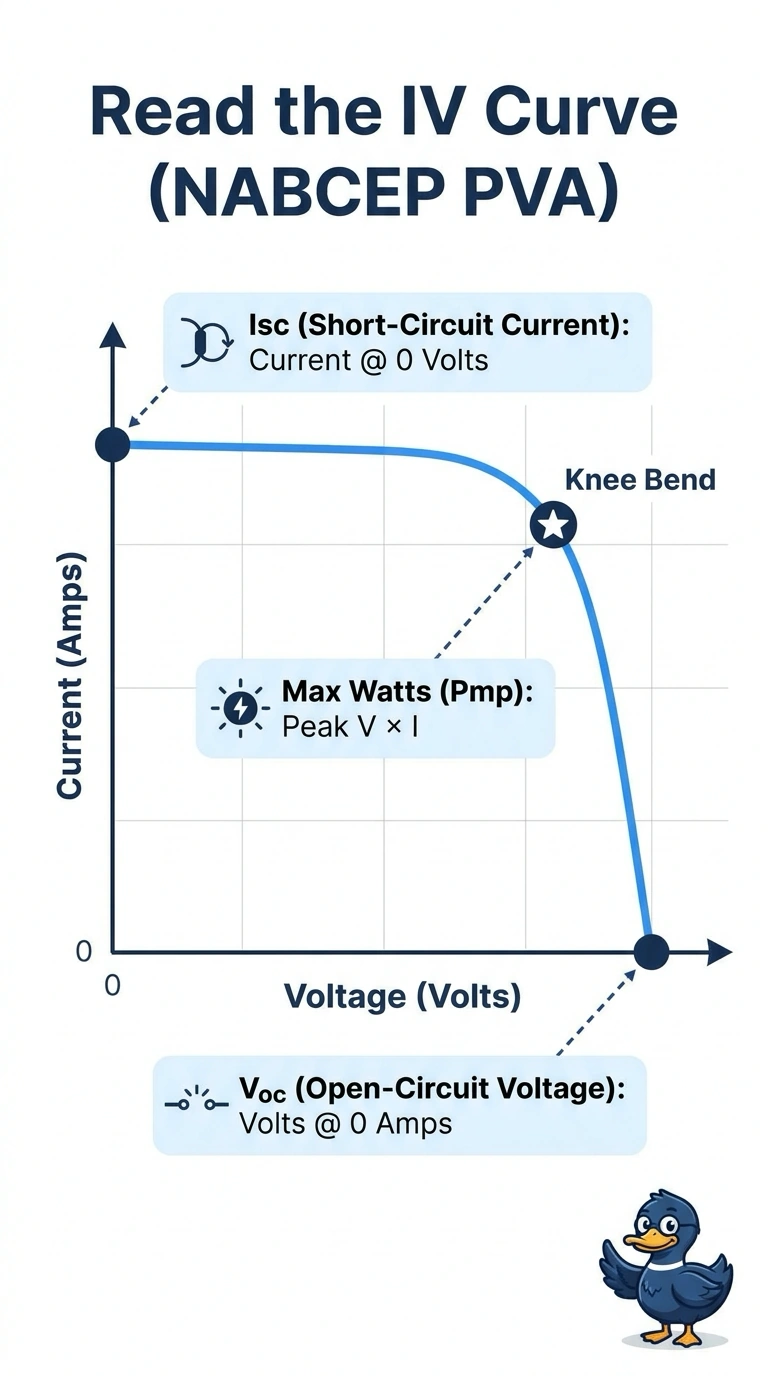
During commissioning of a 12-module string, you capture an IV curve on a sunny day to verify health before handoff. The curve shows zero-current voltage, zero-voltage current, and a knee where power peaks. Which IV curve reading correctly identifies Isc, Voc, and maximum power point for this string?
Select an answer to reveal the explanation.
Short Explanation
Once you see where the axes pinch the curve, the rest clicks into place. Your knee is where volts times amps hits max, with Isc and Voc at the ends.
Full Explanation
The correct reading follows the defining points on the measured IV curve: Isc is the current where voltage is zero, Voc is the voltage where current is zero, and maximum power occurs at the knee, where the product of voltage and current is greatest. The datasheet approach uses legitimate reference values for Isc and Voc, but those are generally specified at standard test conditions and are not readings from this sunny-day string curve; irradiance, temperature, and module variation can make them differ from the measured intercepts. The inverter-telemetry approach can provide a useful operating-power check, but MPPT telemetry reports power at the inverter’s operating point, not necessarily the peak identified on the captured curve, and it does not locate the curve’s knee. Using rated Pmax is also a common nameplate comparison, but it substitutes a standard-condition rating for the measured curve’s maximum power. Exam caveat: a curve tracer’s displayed values may be corrected to standard test conditions, so check whether the question asks for measured or corrected readings. Practical check: confirm the tracer’s voltage and current axes and verify that the knee’s V × I product is greater than nearby points.