
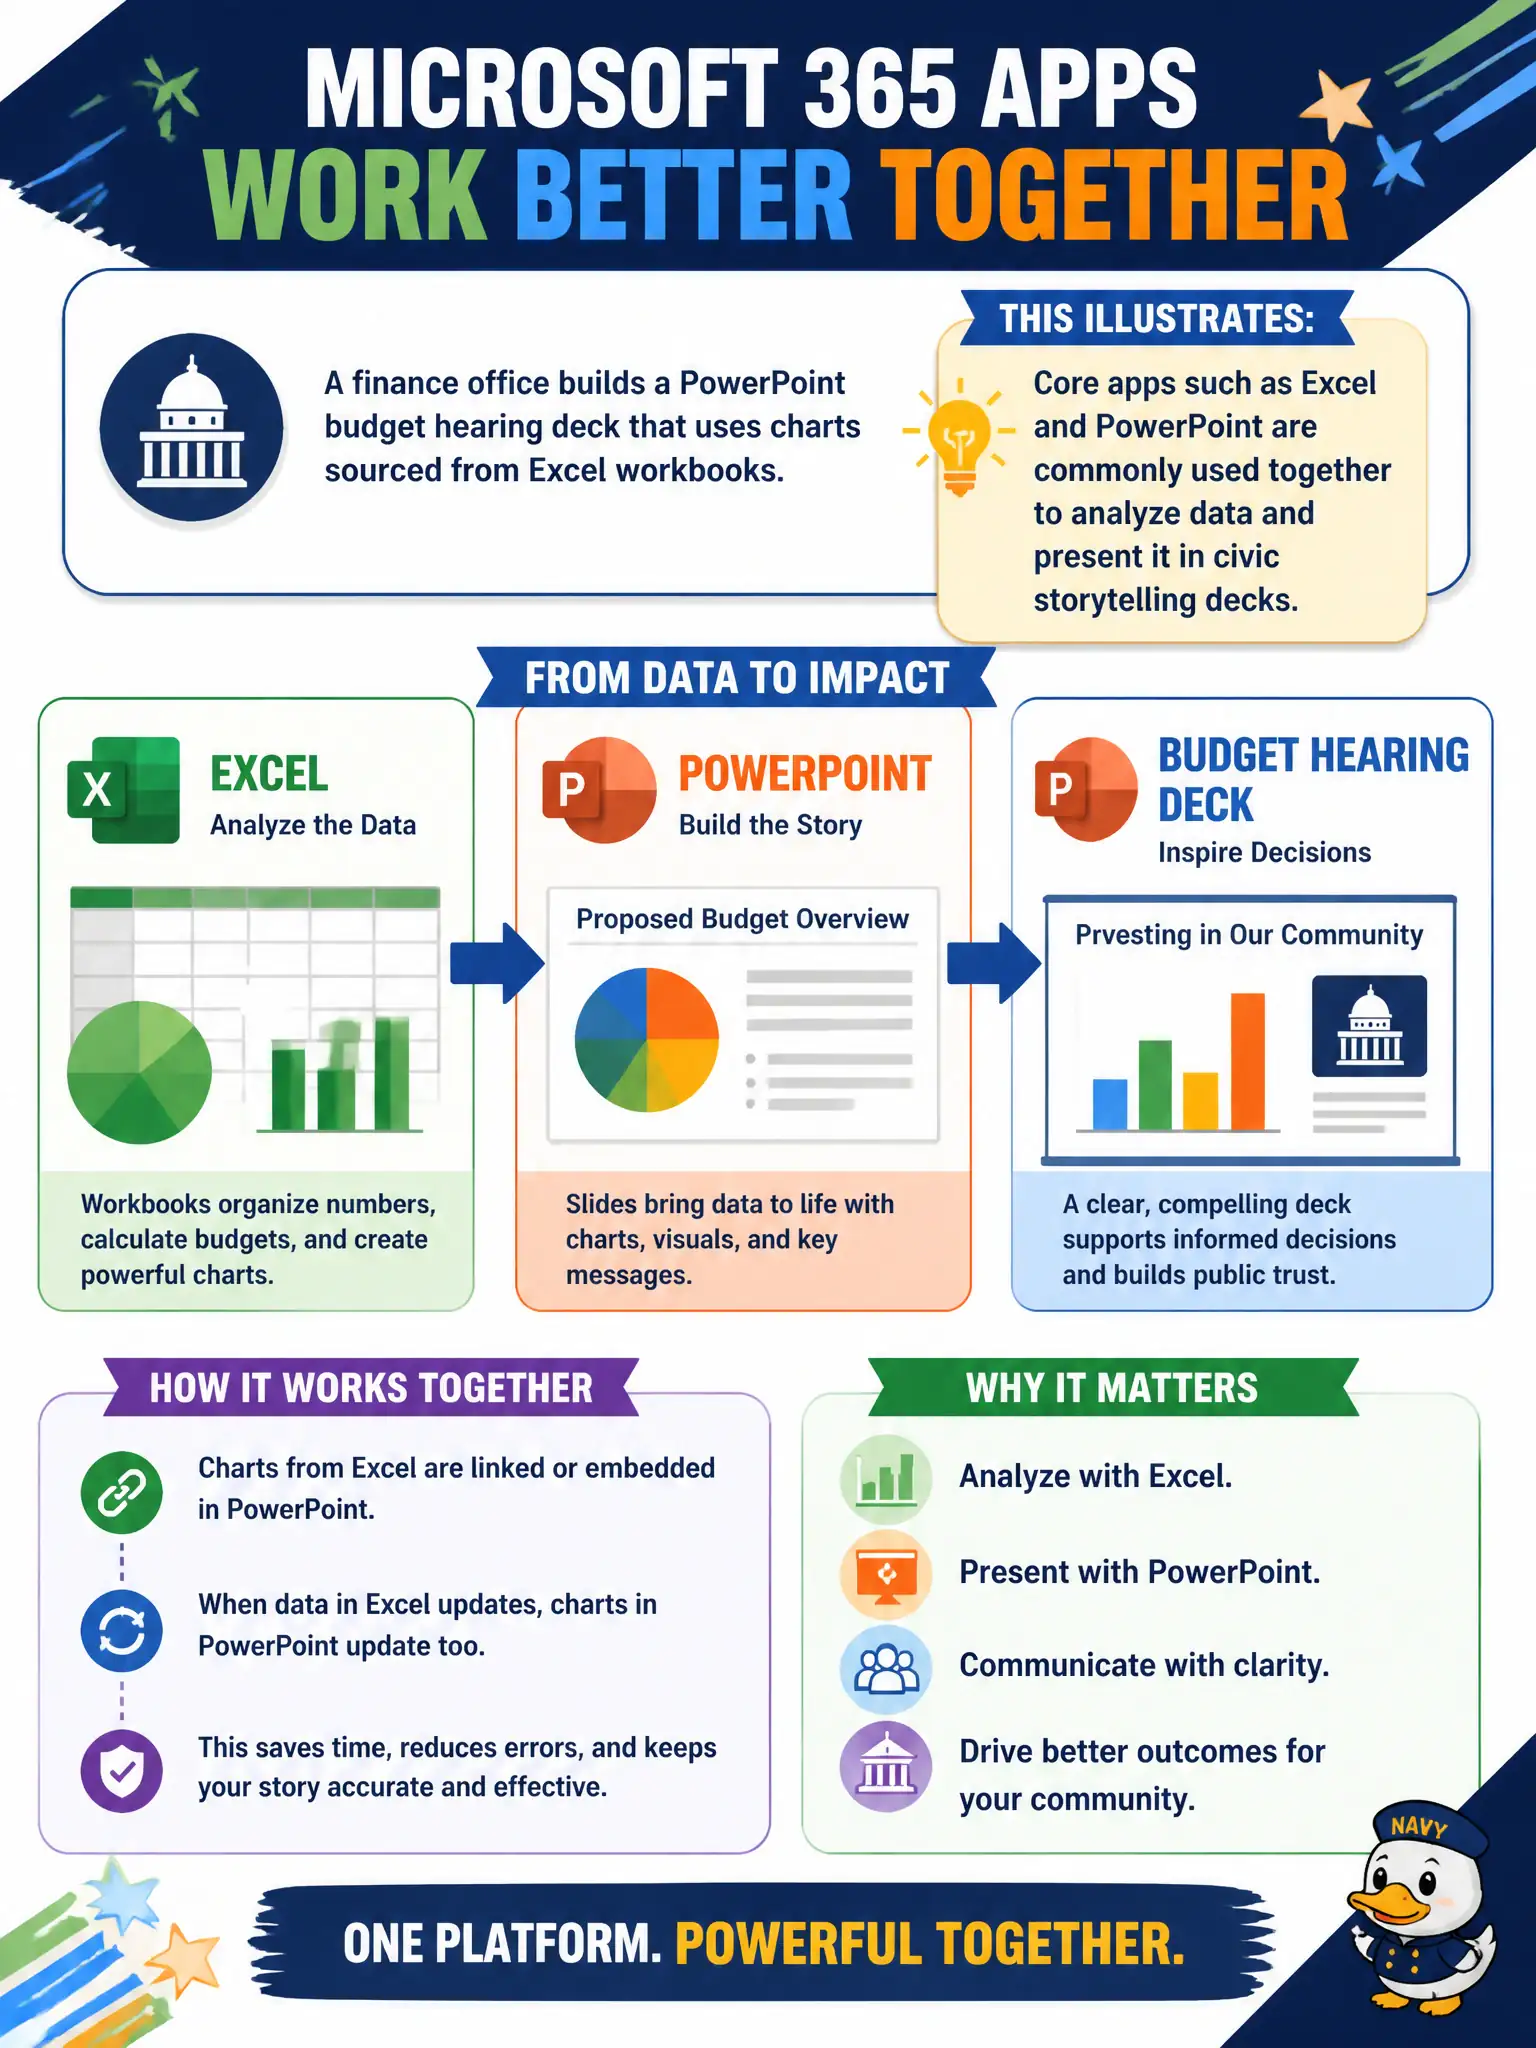
A finance office builds a PowerPoint budget hearing deck that uses charts sourced from Excel workbooks. What does this scenario illustrate about Microsoft 365 productivity apps?
Select an answer to reveal the explanation.
Short Explanation
Excel is the number kitchen; PowerPoint is the stage for the hearing. City budget stories often start as workbook charts and land in slides. Using both together is classic Microsoft 365 productivity teamwork.
Full Explanation
Core Microsoft 365 apps are commonly used together: Excel analyzes data and PowerPoint presents it in civic storytelling decks for budget hearings. The finance office scenario illustrates complementary productivity apps rather than isolated silos.
Claiming PowerPoint cannot display any chart that originated in Excel fails everyday interoperability. Claiming Excel charts can only be shared by mailing USB drives fails cloud collaboration norms. Claiming budget hearings require abandoning Microsoft 365 Apps for a third-party slide tool fails as a necessity.
Exam caveat: linked charts can break if source workbooks move—prefer embedded or carefully linked files in governed libraries. Operational check: finalize numbers in Excel, refresh charts in the PowerPoint hearing deck, store both in the same SharePoint folder, and freeze a PDF packet for the public hearing record. Record the choice in the municipal service catalog so help-desk scripts stay consistent. Record the choice in the municipal service catalog so help-desk scripts stay consistent. Record the choice in the municipal service catalog so help-desk scripts stay consistent. Record the choice in the municipal service catalog so help-desk scripts stay consistent.