
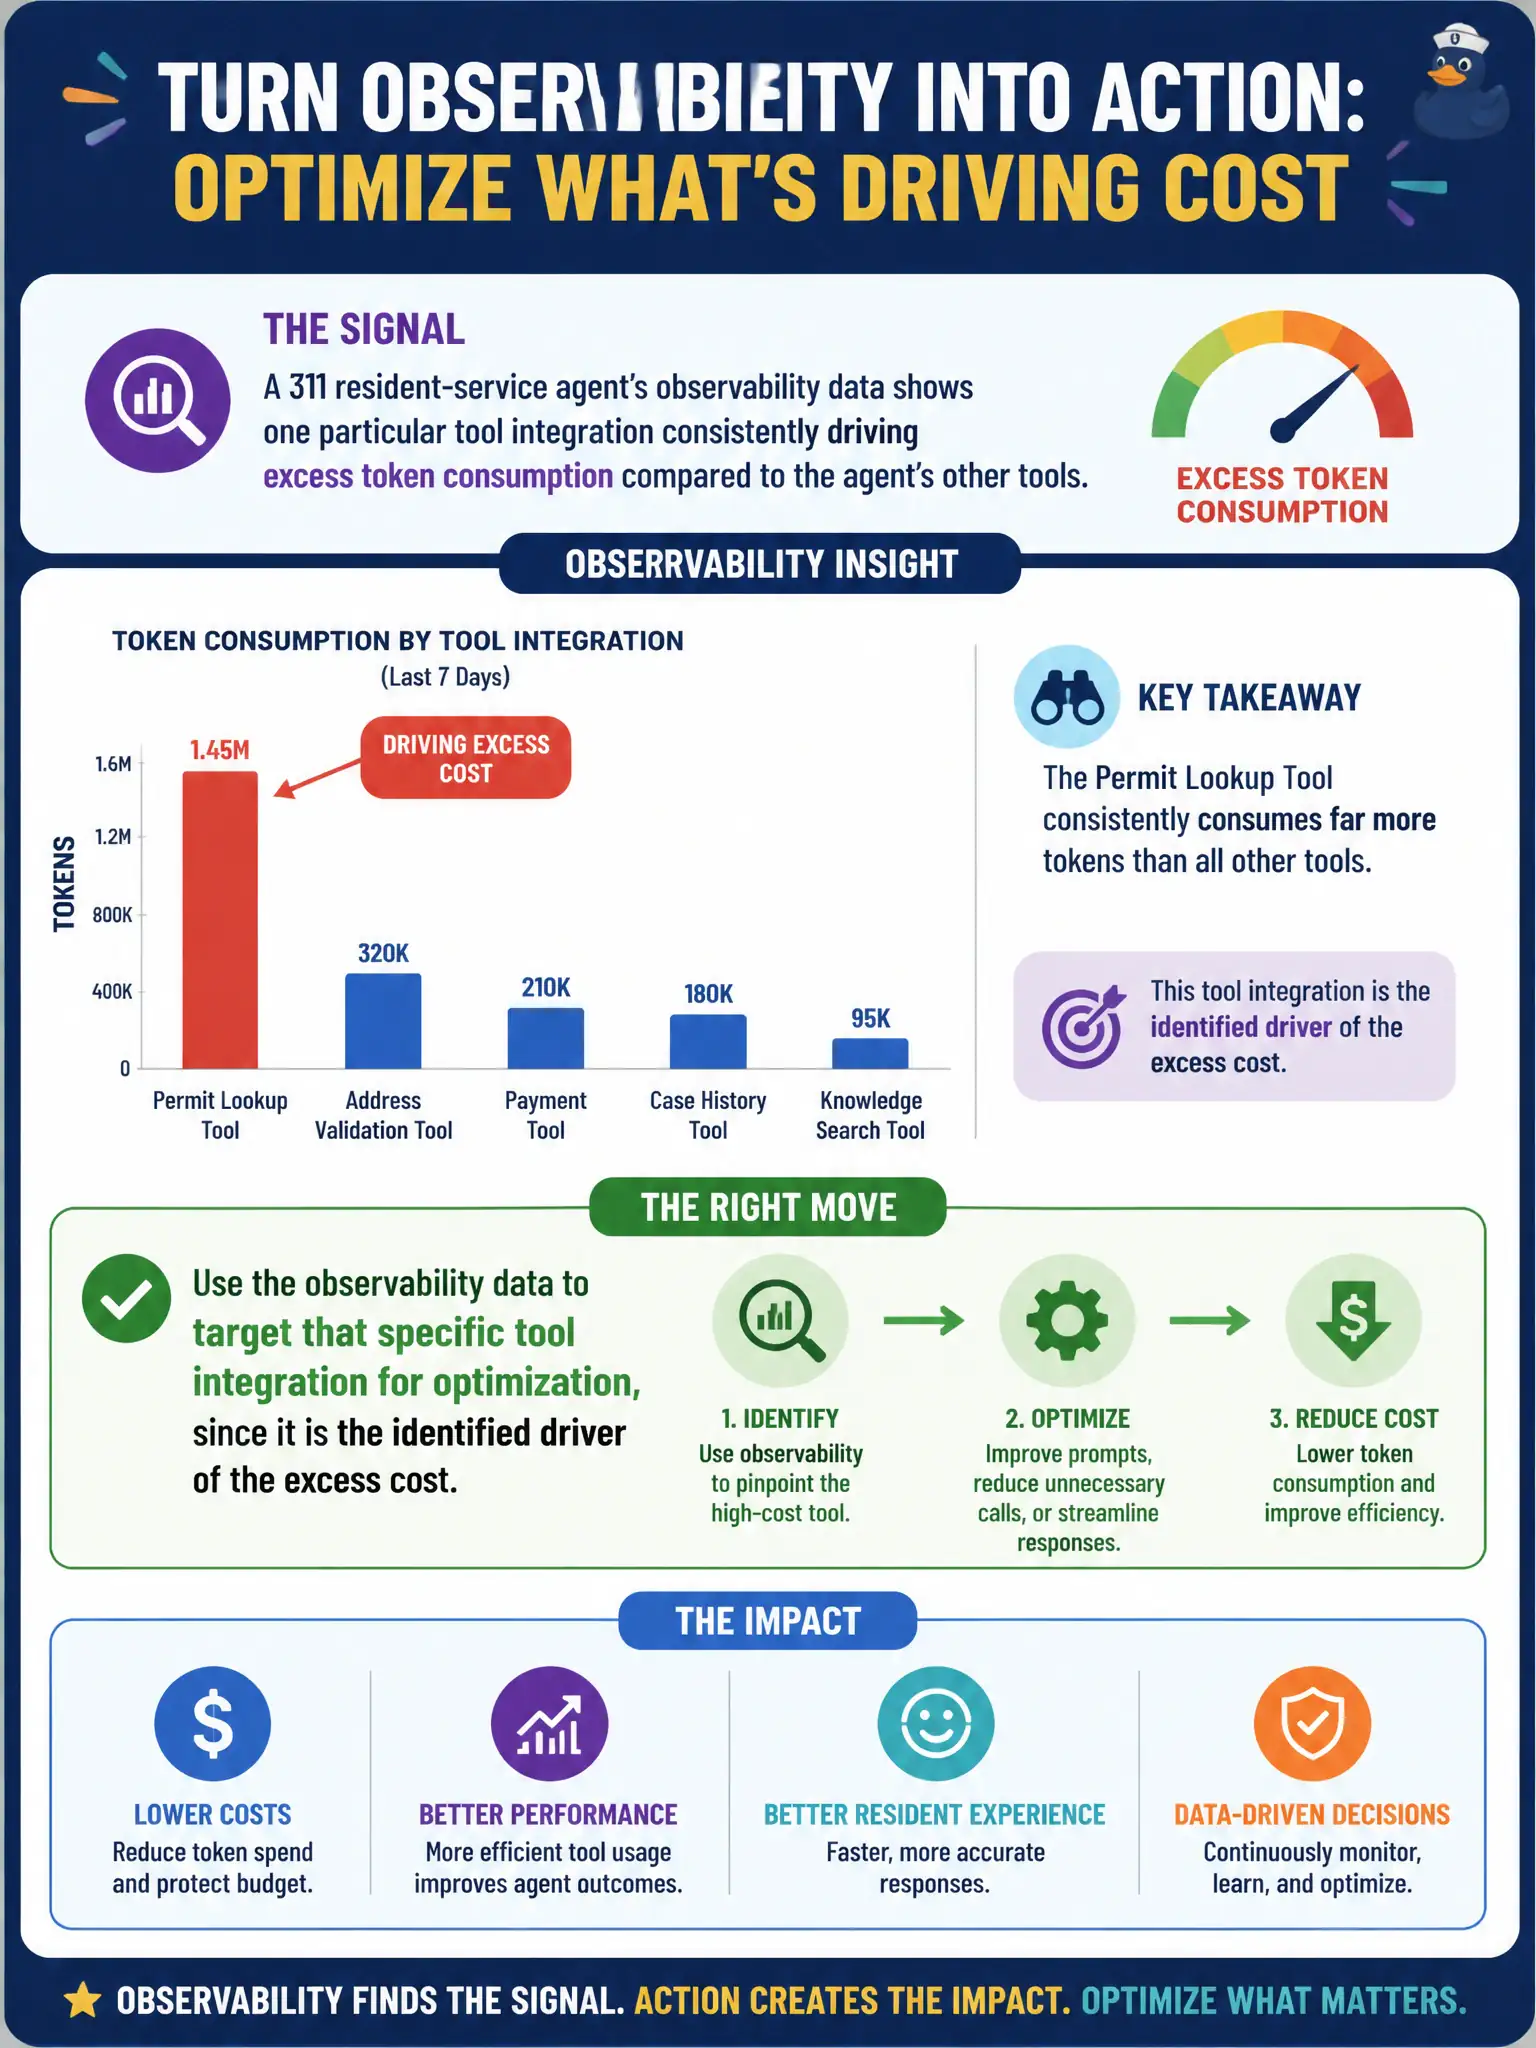
A 311 resident-service agent's observability data shows one particular tool integration consistently driving excess token consumption compared to the agent's other tools. How should the team use this signal?
Select an answer to reveal the explanation.
Short Explanation
When one tool in the toolbox is the one always coming back hot, that's the tool you fix, not the whole belt. Observability data that names the culprit is a gift — it turns a vague cost complaint into a specific, fixable target. Chase the signal, not the average.
Full Explanation
Agent observability data that attributes token consumption per tool integration is precisely the signal needed to target optimization work efficiently — if one tool is the consistent outlier, that's where the cost is concentrated, and that's where a fix (smaller payloads, tighter prompts to that tool, caching its responses) pays off fastest. Uniformly shrinking the context window across the whole agent treats every tool call as equally responsible for the cost, which ignores the very data that already identified an unequal distribution, and it risks degrading the tools that were working fine. Disabling observability reporting for the offending tool doesn't reduce its token consumption at all — it just removes visibility into a real cost driver, making the problem harder to find next time. Moving to a larger foundation model changes the reasoning layer, not the tool-call layer, and provides no guarantee that a bigger model reduces calls to a specific integration that is driving cost through its own payload size or call frequency. Scope caveat: confirm the offending tool's cost driver — payload size versus call frequency — since the fix differs by cause. Operational check: re-run the observability report after the fix and confirm that specific tool's token share has actually dropped.