
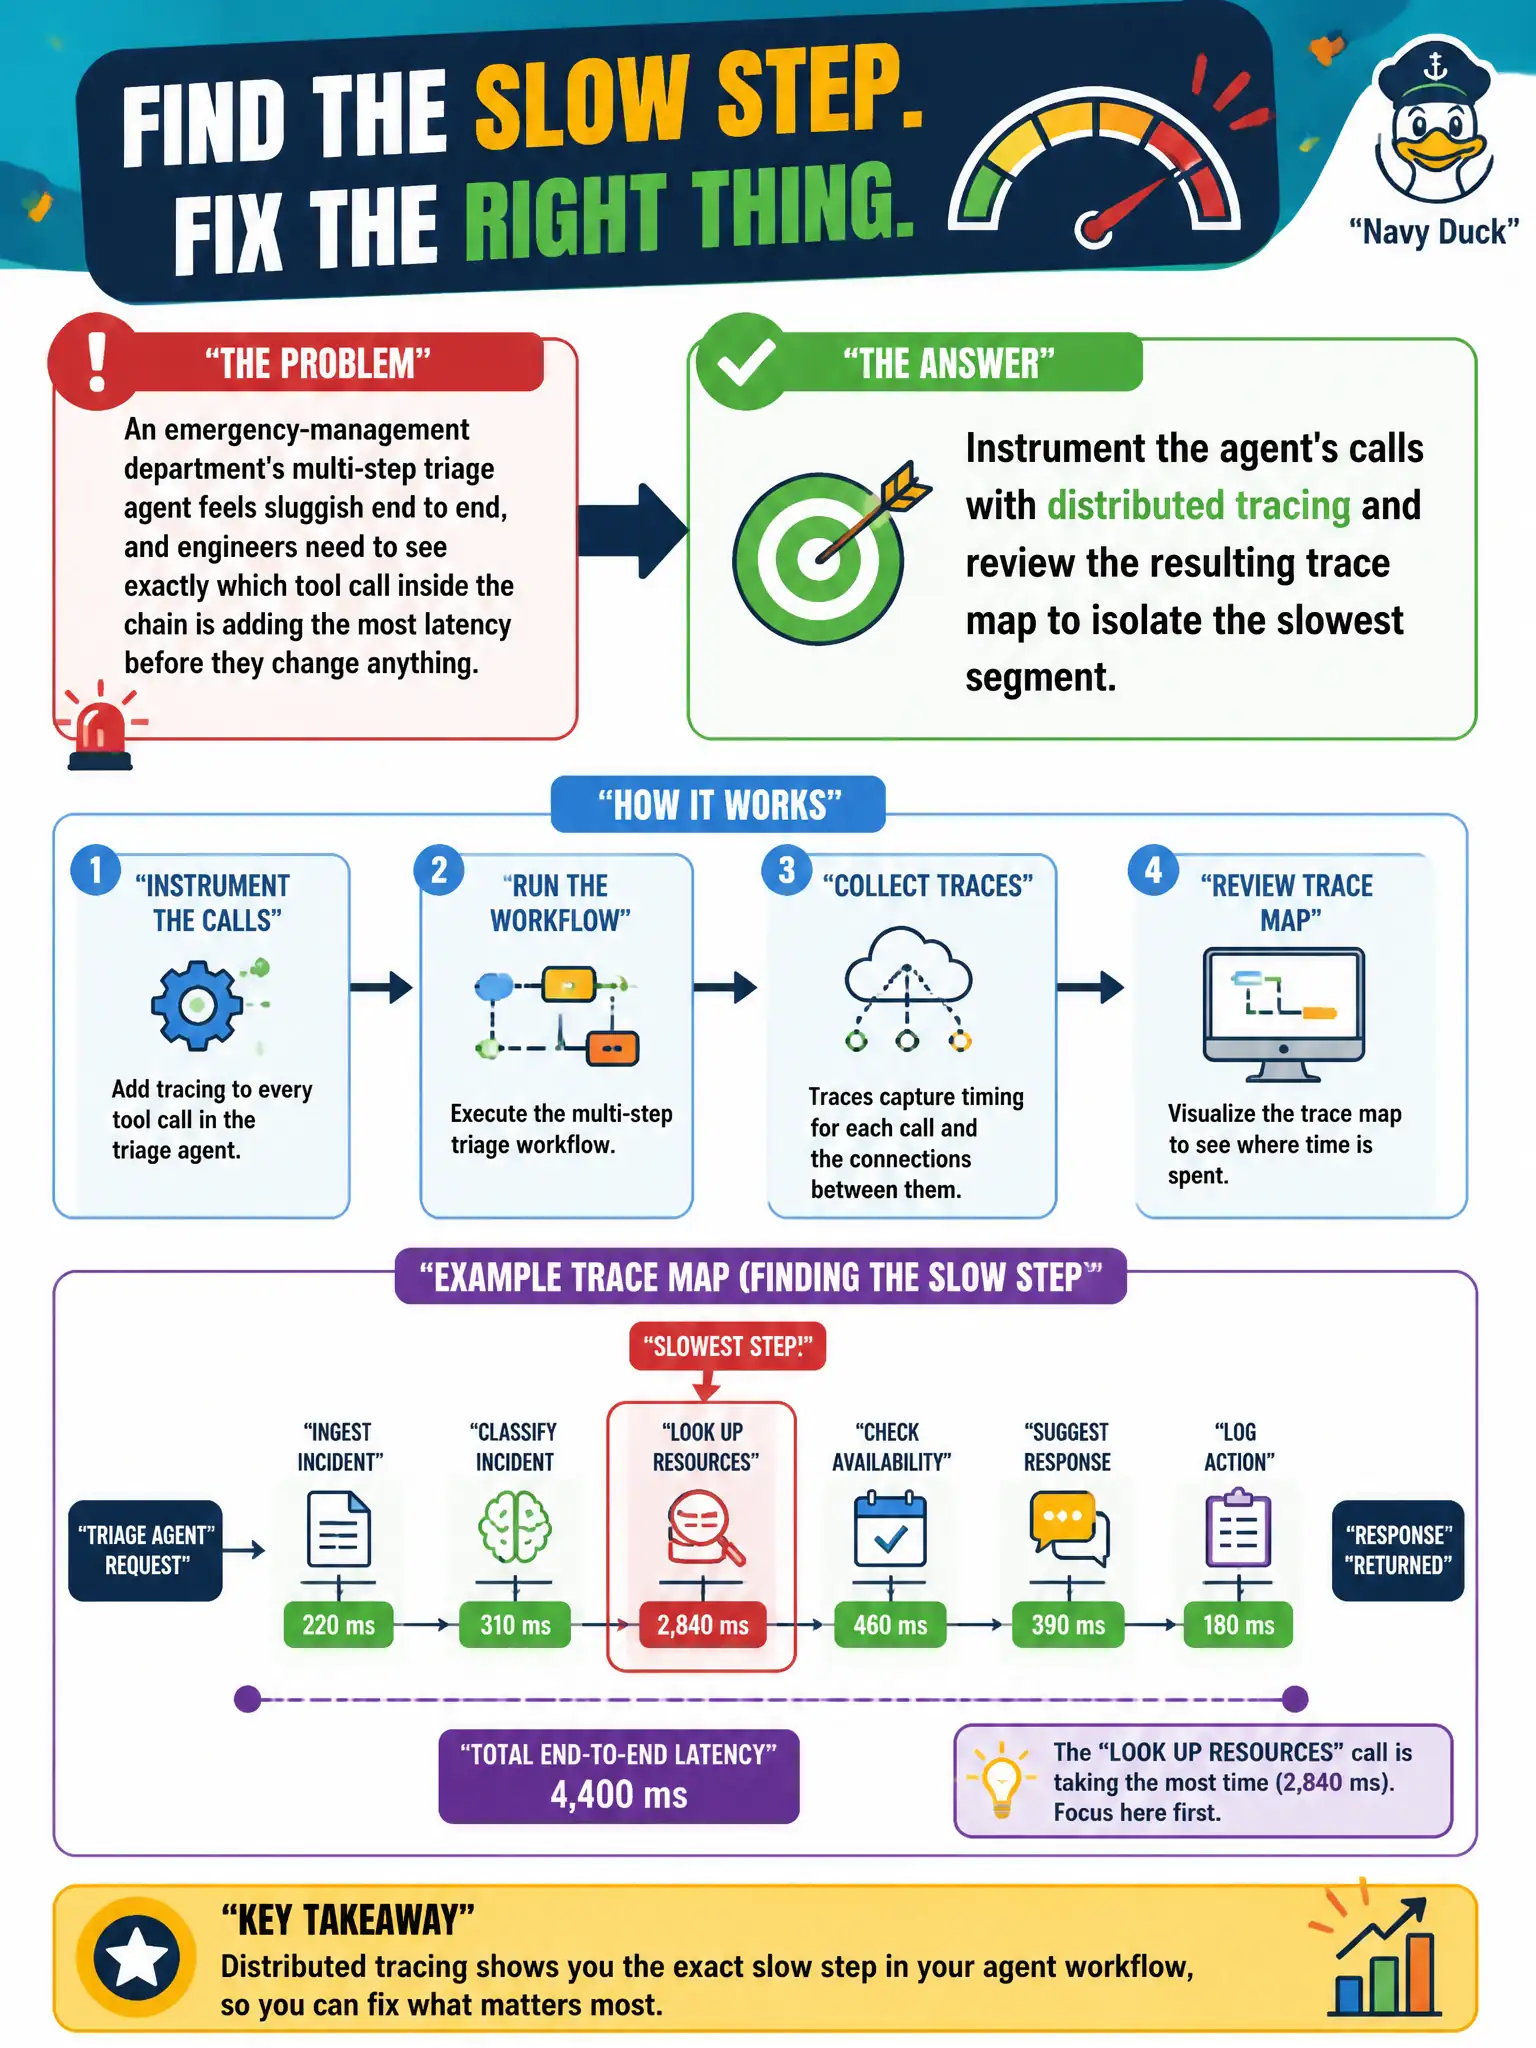
An emergency-management department's multi-step triage agent feels sluggish end to end, and engineers need to see exactly which tool call inside the chain is adding the most latency before they change anything. Which approach pinpoints the slow step?
Select an answer to reveal the explanation.
Short Explanation
Picture the agent's workflow as a relay race: something is stopping to tie its shoes mid-handoff, and you need to know which runner it is before you tell anyone to "run faster." Distributed tracing draws that relay out step by step, so the slow leg is visible instead of guessed at. That's a lot cheaper than throwing compute at every leg equally.
Full Explanation
An agentic workflow strings together multiple tool calls, and slowness in one of those calls can make the whole chain feel sluggish without telling you where the delay actually lives. Distributed tracing instruments each hop in the request path and records timing for every segment, so you get a visual breakdown of where time is actually spent rather than a single end-to-end number. Reviewing that trace map lets engineers isolate the specific tool call adding latency and fix that one dependency instead of guessing. Scaling up compute on every model the agent touches spends money uniformly across a problem that is actually localized, and won't help if the bottleneck is a slow external tool call rather than model inference. Manually scanning raw logs for slow timestamps works in theory but does not correlate timing across the whole call chain the way a trace does, and it does not scale as the workflow grows more steps. Reducing retry counts changes failure-handling behavior but does nothing to identify or fix a genuinely slow step; it only means the agent gives up on it faster. As an operational check, look at the trace's per-segment duration breakdown and confirm the flagged segment's latency actually drops after the targeted fix, rather than assuming the whole workflow got faster.