
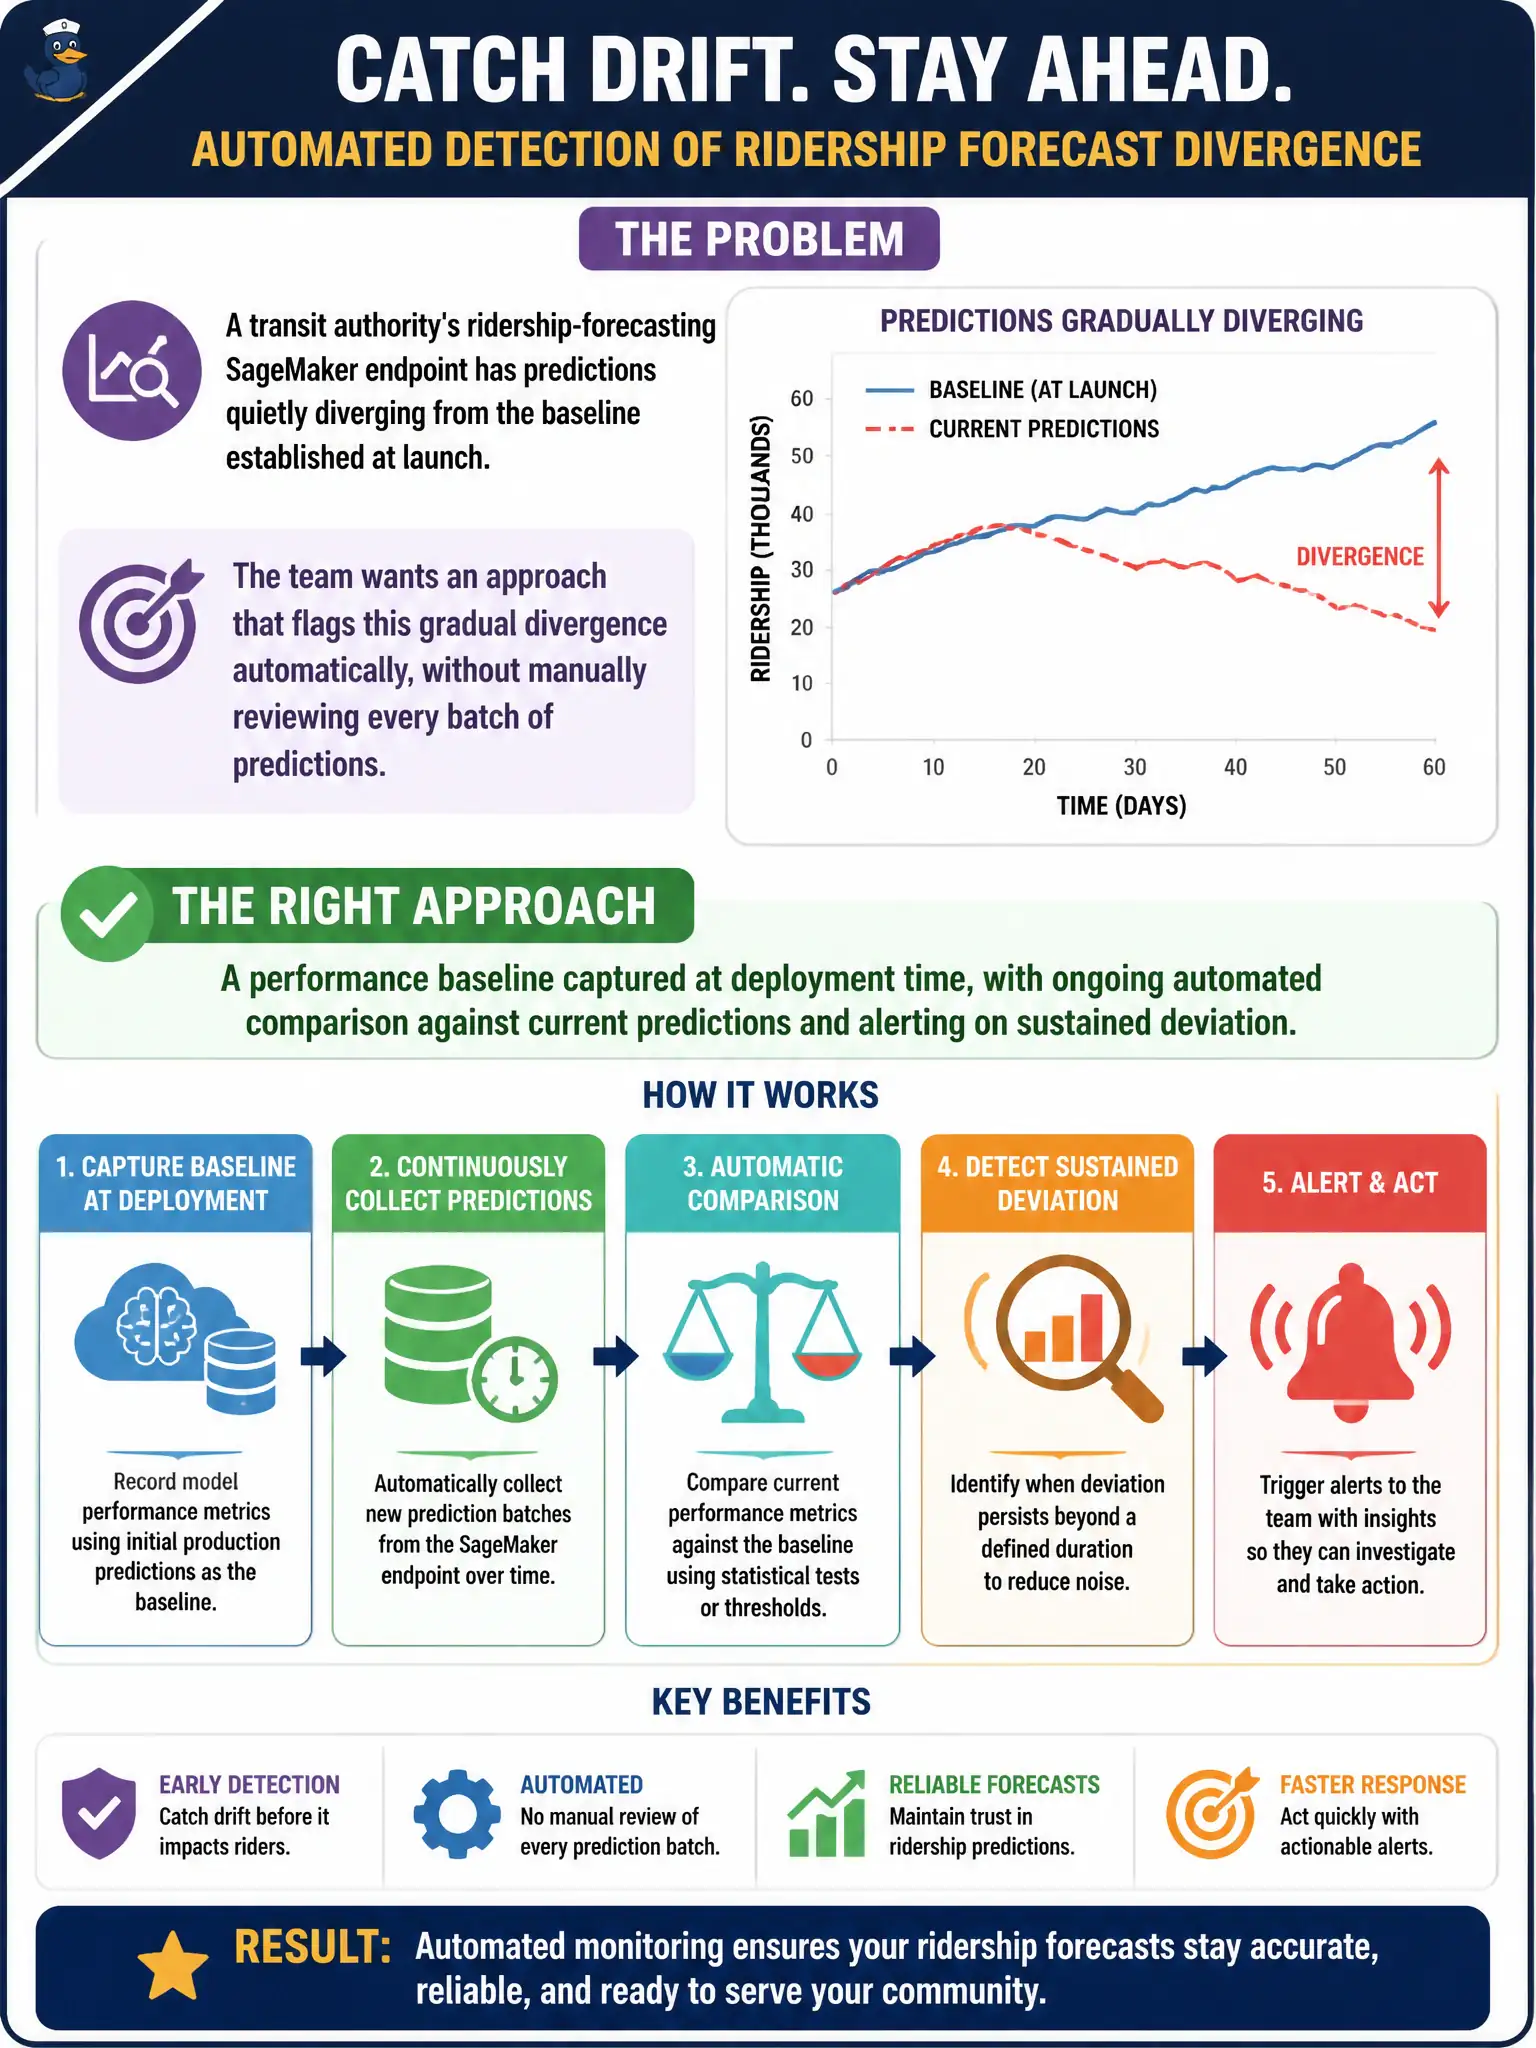
A transit authority's ridership-forecasting SageMaker endpoint has predictions quietly diverging from the baseline established at launch. The team wants an approach that flags this gradual divergence automatically, without manually reviewing every batch of predictions. Which approach fits?
Select an answer to reveal the explanation.
Short Explanation
Gradual drift is sneaky; no single bad prediction trips an alarm, it's the slow creep over weeks that matters. Capturing a performance baseline at launch and continuously comparing today's predictions against it is like tracking a trend line instead of glancing at one data point. That's what catches the quiet divergence before it becomes an obvious problem.
Full Explanation
Establishing a performance baseline at deployment time and running an ongoing, automated comparison against it lets the monitoring system detect a sustained trend of divergence, exactly the kind of quiet, gradual drift described here, where no single prediction looks wrong but the pattern over time does. A one-time load test measures latency and throughput at a fixed moment before deployment; it says nothing about how predictions behave weeks later as ridership patterns change. An alarm on a missing value in a single batch catches a data-completeness problem, not a slow accuracy decline, since the predictions here are still being produced, just drifting from expectations. A manual weekly spreadsheet comparison technically catches the trend eventually, but it depends on a person remembering to run it and interpret it correctly, which is the opposite of an automated monitoring approach and doesn't scale. Scope caveat: a baseline comparison needs periodic recalibration, since ridership patterns shift seasonally for legitimate reasons that aren't model degradation. A concrete operational check: review the baseline-comparison trend chart monthly to confirm alerts correlate with real accuracy loss rather than expected seasonal ridership swings.