
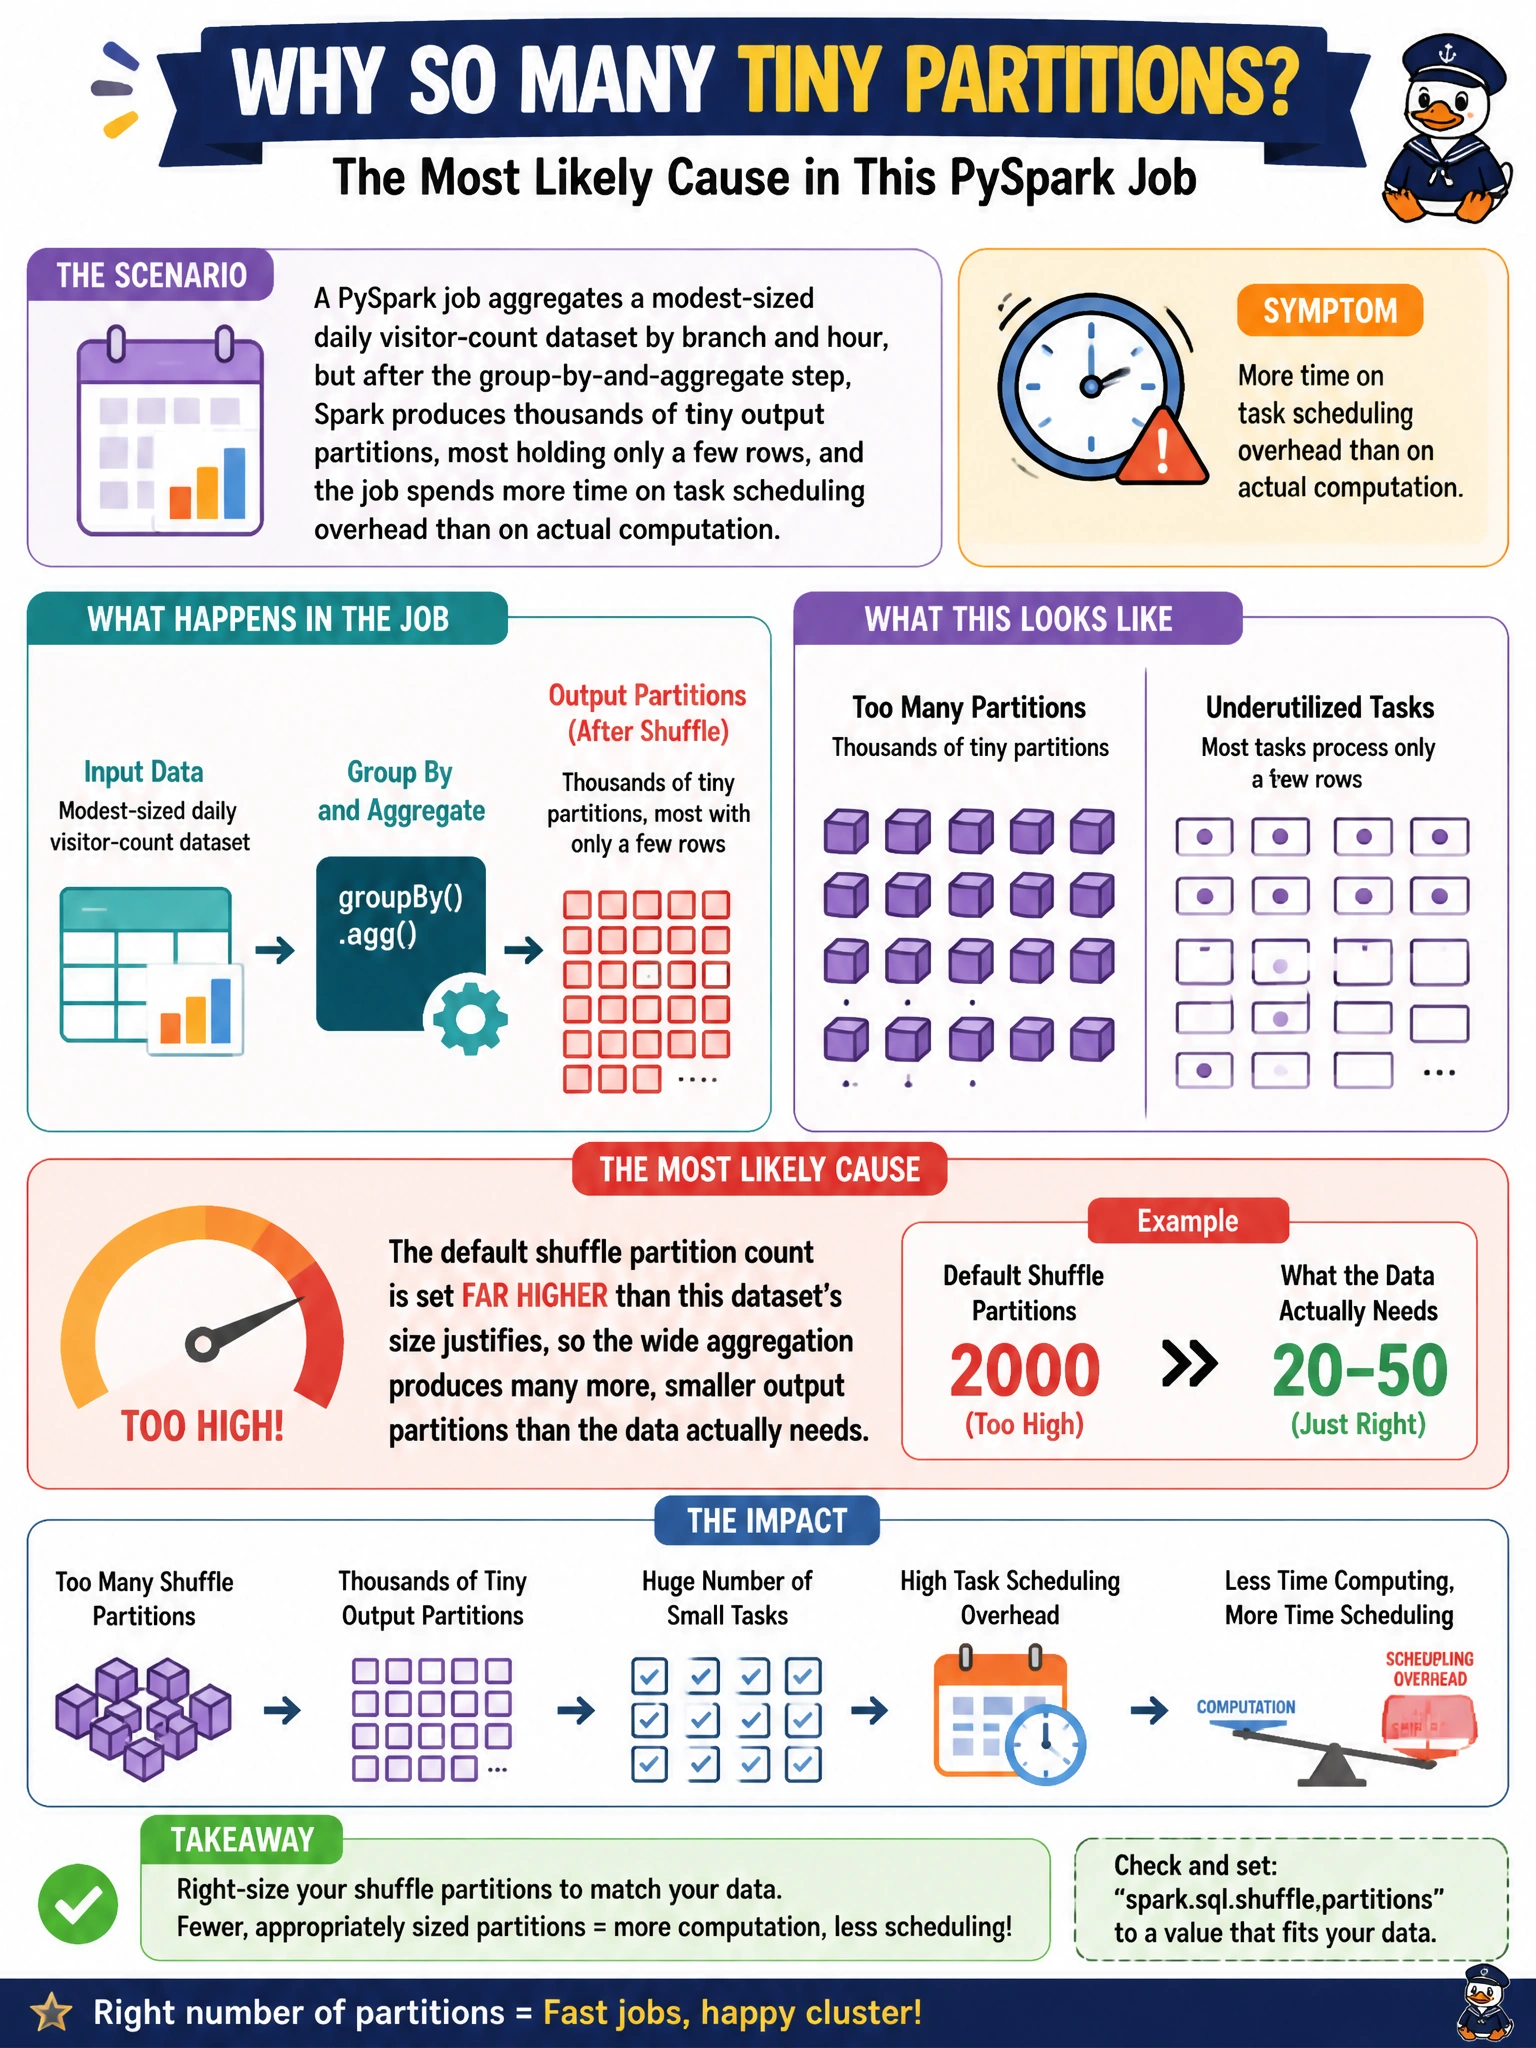
A PySpark job aggregates a modest-sized daily visitor-count dataset by branch and hour, but after the group-by-and-aggregate step, Spark produces thousands of tiny output partitions, most holding only a few rows, and the job spends more time on task scheduling overhead than on actual computation. What is the most likely cause?
Select an answer to reveal the explanation.
Short Explanation
Spark's shuffle-partition setting is like deciding in advance how many serving trays to prepare for a group-by, no matter how much food you actually end up with. Leave that number at a high default and a modest dataset still gets spread across thousands of trays, most nearly empty. Turning that number down to match the data's real size means fewer, fuller trays — and a lot less overhead managing empty ones.
Full Explanation
A wide operation like group-by-and-aggregate triggers a shuffle, and the number of partitions Spark produces from that shuffle is controlled by a shuffle-partition setting that defaults to a fixed number regardless of the actual data size; for a genuinely modest dataset, that default is often far higher than needed, so the aggregation output gets spread thin across thousands of mostly-empty partitions, and the overhead of scheduling and managing that many tiny tasks starts to dominate over the real computation. Lowering the shuffle-partition count (or enabling adaptive query execution to let Spark determine it automatically) matches partition count to actual data volume and removes that overhead. Uncompacted source files would cause a small-file problem on read, before the shuffle even happens, but it wouldn't explain the output of the aggregation step specifically being over-partitioned — the symptom described is about post-aggregation output, not pre-aggregation input. V-Order affects how files are encoded for faster downstream reads; it has no relationship to how many partitions a Spark shuffle produces. A Spark pool without autoscaling might limit total available nodes, but it wouldn't force every task onto a single node, and it doesn't determine the number of shuffle partitions Spark plans to create. A caveat: setting shuffle partitions too low for a genuinely large dataset can create the opposite problem — too few, overly large partitions that cause memory pressure — so the setting (or adaptive execution) should track real data volume rather than being fixed at either extreme. A concrete check: review the Spark UI's stage details for the aggregation step to see output partition count and average partition size before and after adjusting the setting.