
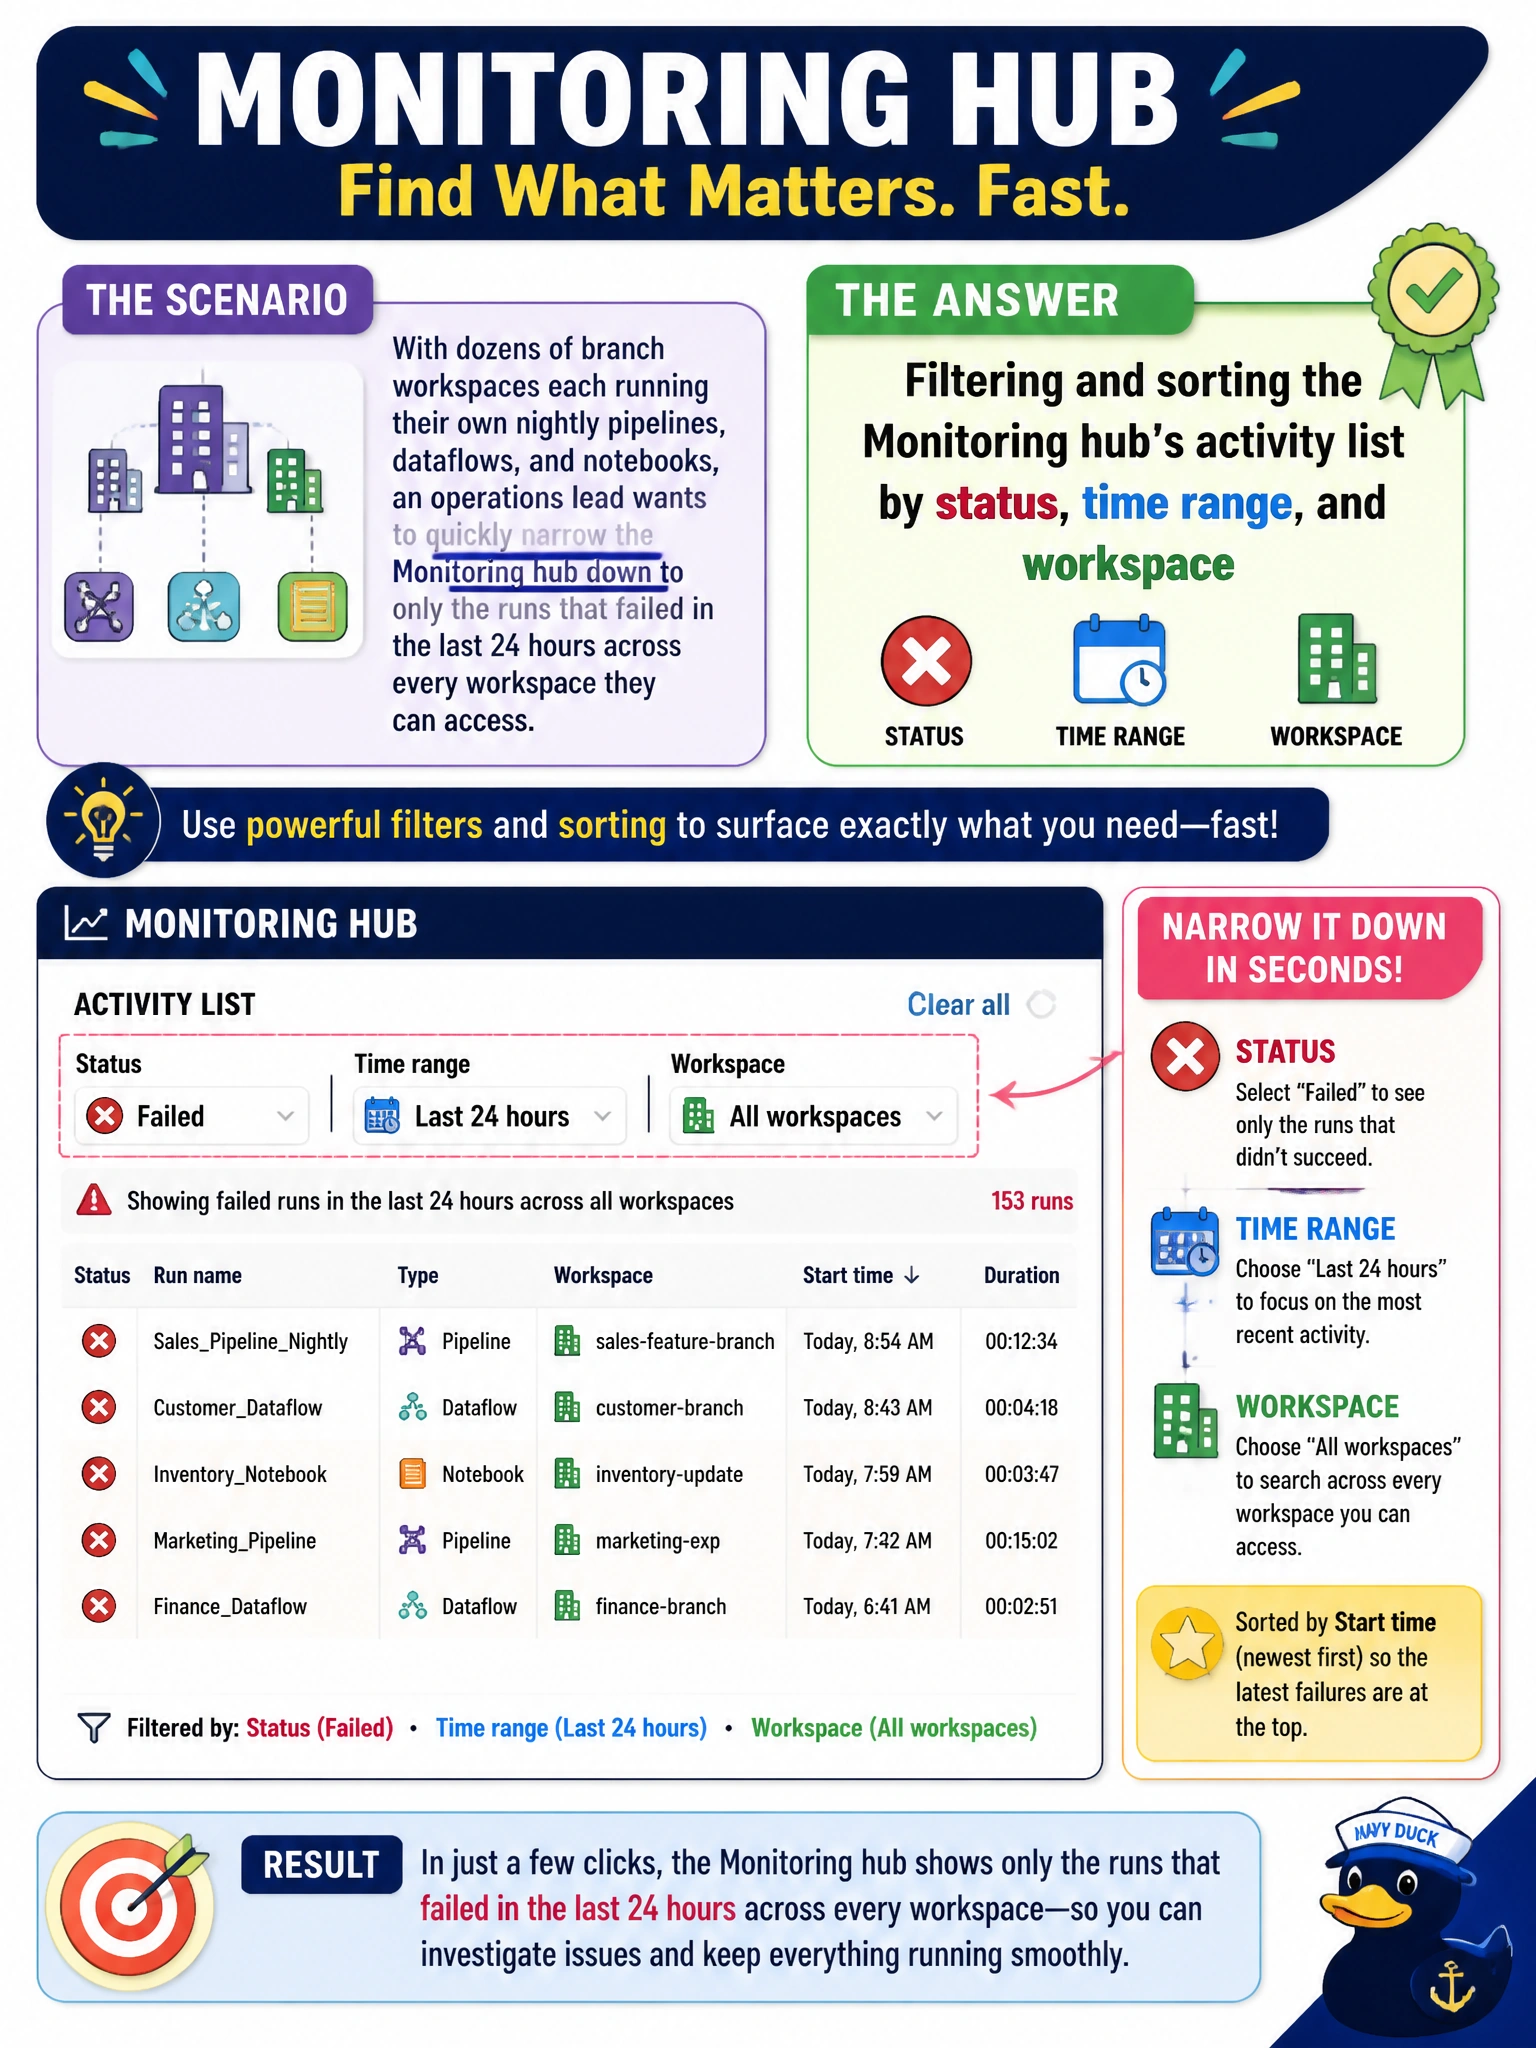
With dozens of branch workspaces each running their own nightly pipelines, dataflows, and notebooks, an operations lead wants to quickly narrow the Monitoring hub down to only the runs that failed in the last 24 hours across every workspace they can access. Which capability of the Monitoring hub supports this?
Select an answer to reveal the explanation.
Short Explanation
The Monitoring hub isn't just a list, it's a filterable one, closer to a spreadsheet with column filters than a printed report. That's what lets the operations lead narrow straight to "failed" and "last 24 hours" without scrolling through everything.
Full Explanation
The Monitoring hub supports filtering and sorting its aggregated activity list by attributes such as status, item type, workspace, and time window, which lets an operations lead go straight from "everything that ran anywhere" to "only the failures from the last day" in a few clicks, exactly the narrowing this scenario calls for. Exporting the whole activity log and searching it manually would technically work but throws away the built-in filtering the hub already provides, turning a few clicks into a manual spreadsheet exercise across dozens of workspaces. Opening each workspace's item list individually doesn't scale to dozens of branches and, more importantly, an item list shows current item state, not a historical log of which runs failed. Reading an Eventstream's data preview only shows live throughput for one specific stream at a time and has no concept of "failed" runs or cross-workspace aggregation at all. Once filtered to failures, sorting by duration or item type is often the next useful step, since it can reveal whether one workspace or one item type is responsible for most of the failures.