
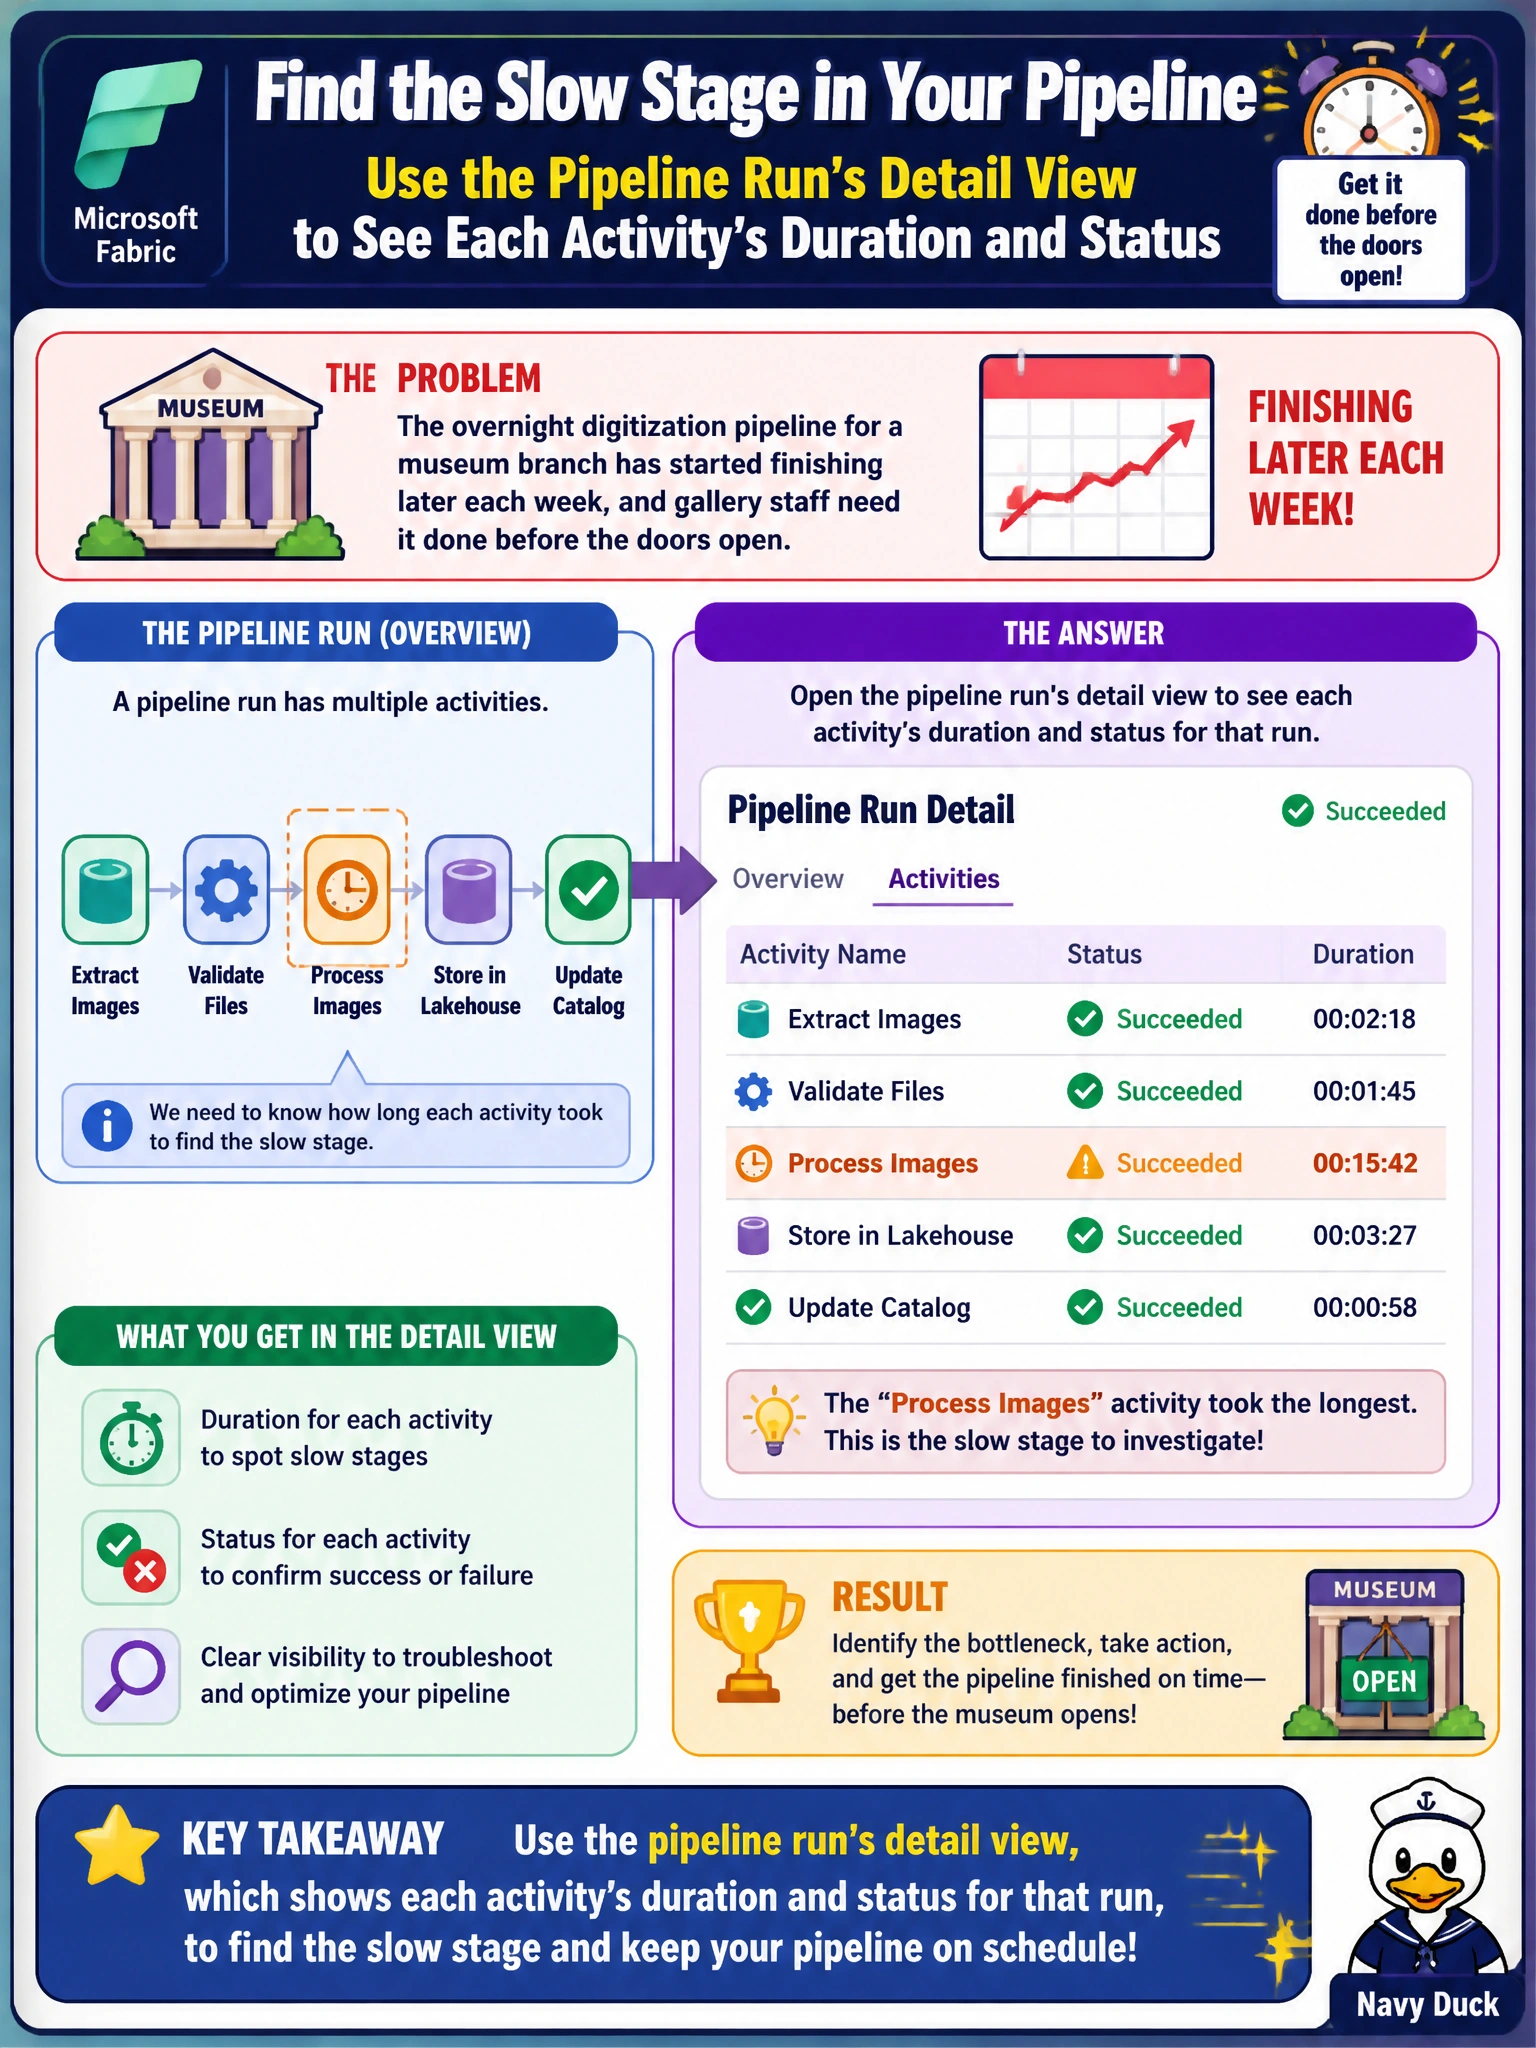
The overnight digitization pipeline for a museum branch has started finishing later each week, and gallery staff need it done before the doors open. Which Fabric monitoring view lets an engineer see how long each activity inside that pipeline run took, so the slow stage can be identified?
Select an answer to reveal the explanation.
Short Explanation
Picture the pipeline run detail view like a race replay that breaks the whole lap into splits. It shows each activity in that run with its own start time, duration, and status, so a slow leg jumps out instead of hiding inside one overall runtime number.
Full Explanation
Opening a specific pipeline run's detail view surfaces every activity in that run individually, each with its own duration and outcome, which is exactly what's needed to isolate the stage that has been creeping later week over week, whether that's a copy activity pulling more data, a slow notebook step, or a dependent wait. Workspace access controls govern who can view, edit, or execute items; they have nothing to do with how long a run took and would not help diagnose a lengthening schedule. A semantic model's refresh history reports on Power BI or Direct Lake dataset refreshes specifically, a different item type entirely from a data pipeline, so it would not contain the digitization pipeline's activity timings at all. Lineage view maps how items depend on and feed each other across a workspace, which is useful for understanding blast radius but shows no timing information whatsoever. Once the slow activity is identified from the run detail view, the natural next check is whether its input volume has grown or whether a shared resource, like compute concurrency, has become a bottleneck during that time window.