
A regional archives supervisor wants a single place each morning to check the status of last night's digitization pipeline runs, Dataflow Gen2 refreshes, and notebook jobs across every branch workspace before opening the reading room. Which Fabric monitoring surface should they check first?
Select an answer to reveal the explanation.
Short Explanation
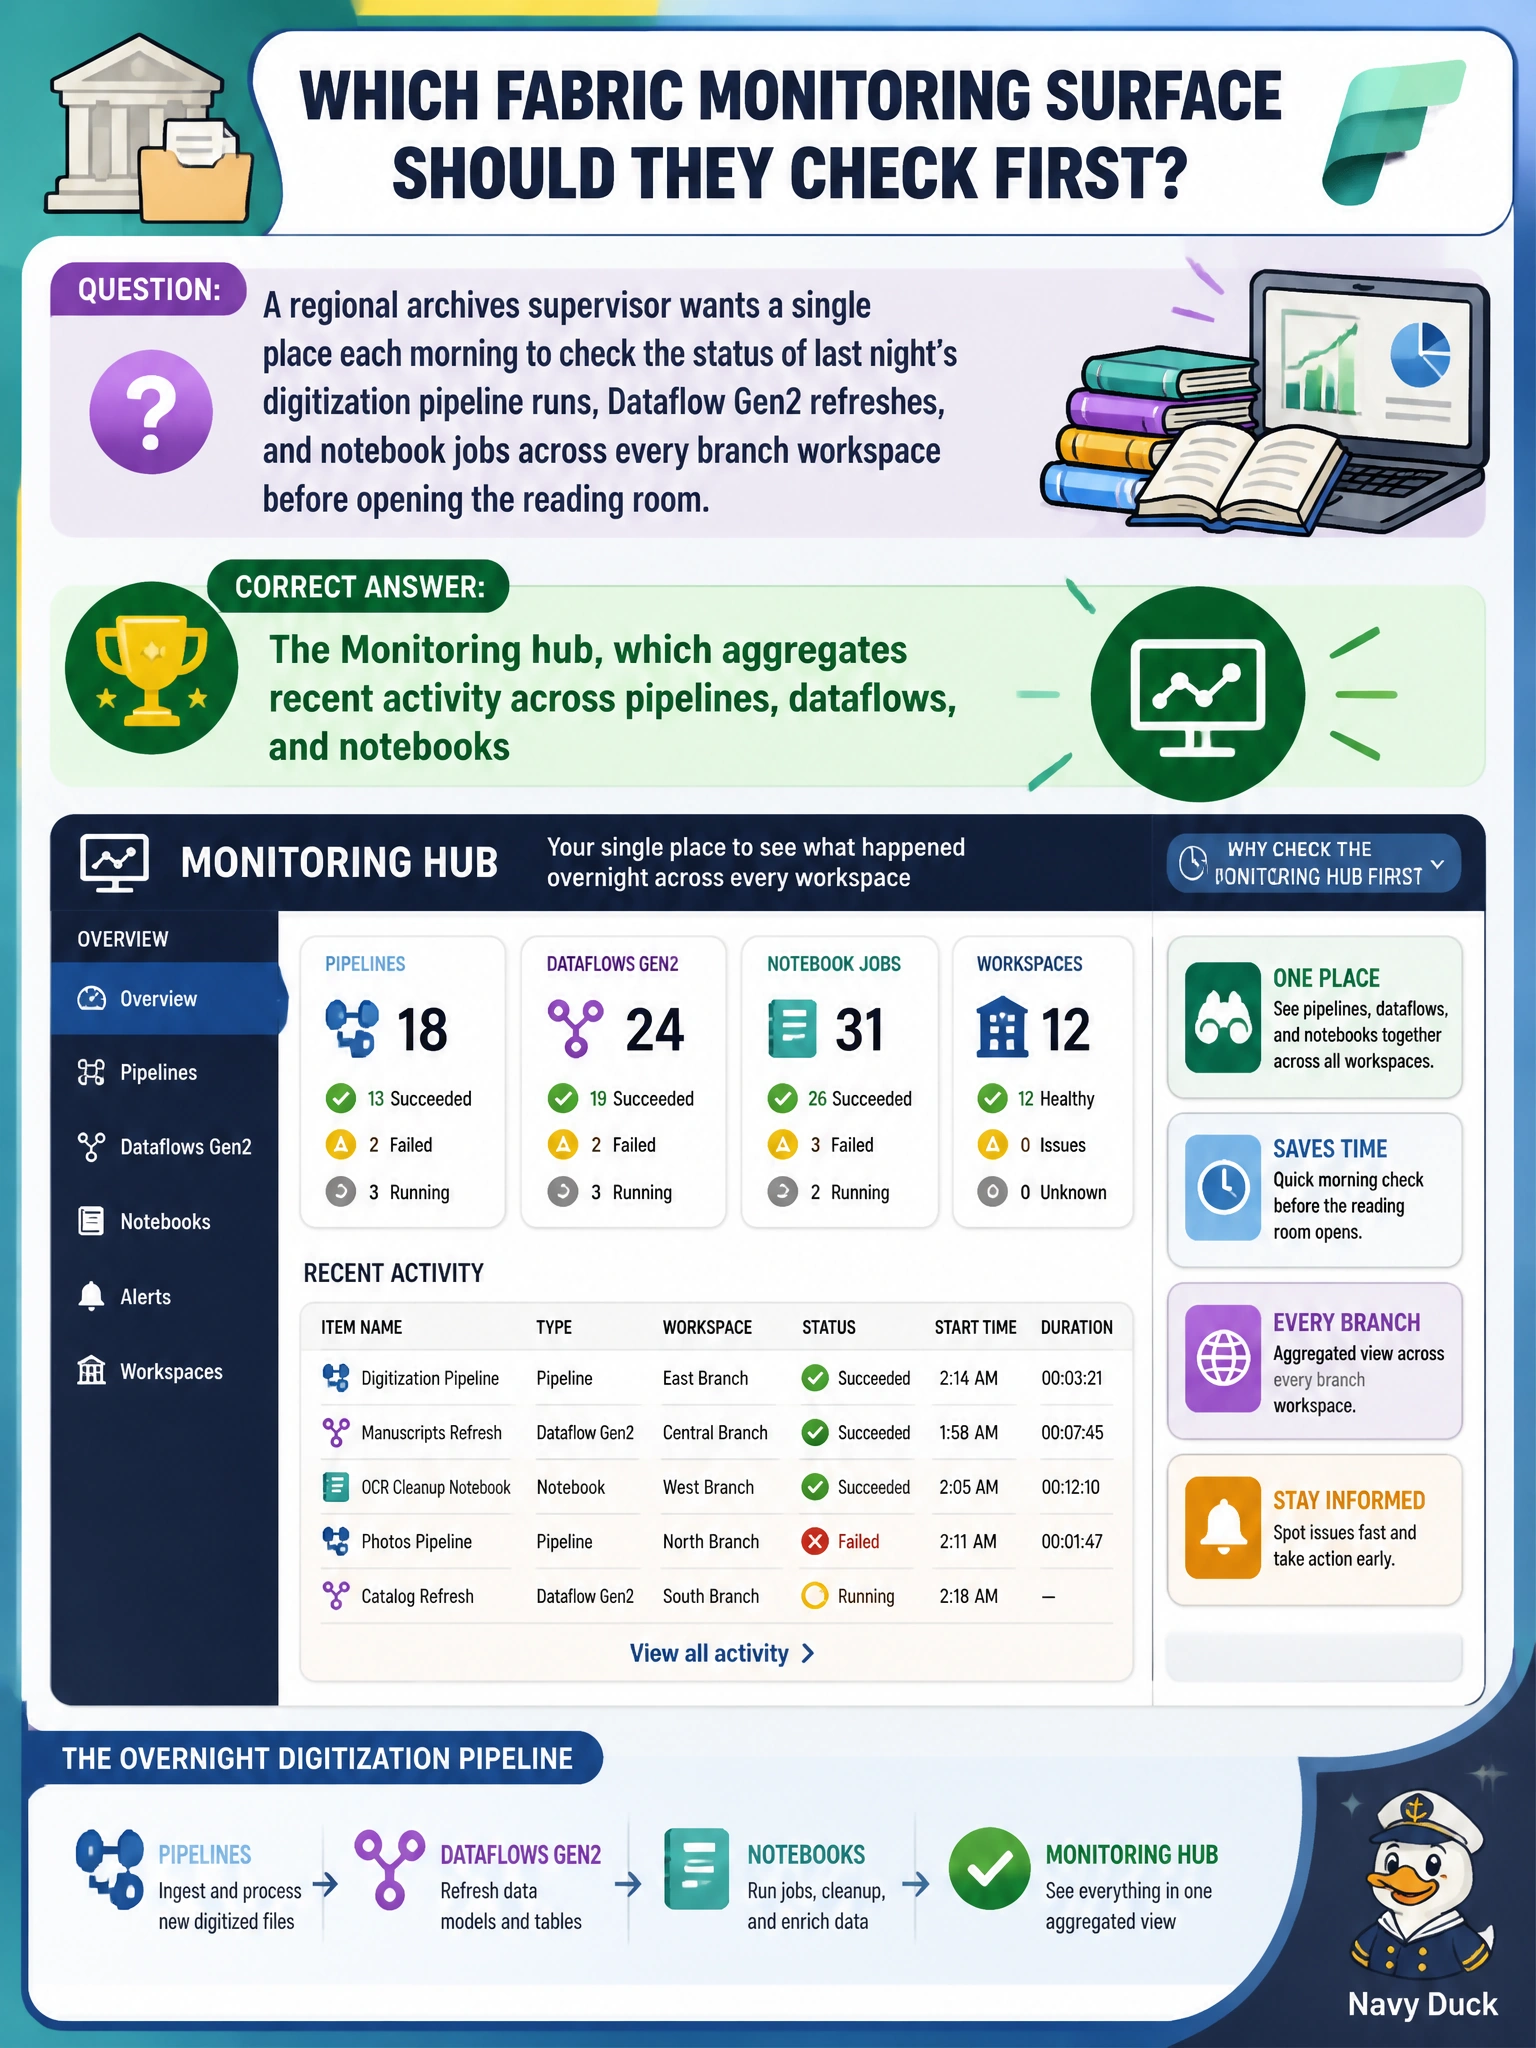
Think of the Monitoring hub like a control room with one wall of screens instead of running to each machine separately. It rolls up runs from pipelines, Dataflow Gen2 refreshes, and notebooks into one filterable list, so there's no need to open every item just to see what ran and how it went.
Full Explanation
The Monitoring hub is Fabric's cross-item activity surface: it aggregates recent runs from pipelines, Dataflow Gen2 refreshes, notebook and Spark jobs, and more into one list that can be filtered by workspace, item type, status, or time window, which is exactly what a supervisor scanning many branch workspaces at once needs. The Capacity Metrics app answers a different question: it reports compute consumption and throttling against the capacity's allotted resources, broken down by operation, not a simple pass-or-fail run log meant for a quick morning scan. Sorting a workspace's item list by last-modified date only shows when an item's definition changed, not whether its most recent run succeeded, so a job that failed silently overnight would look identical to one that never ran. A KQL Queryset is scoped to querying data inside a specific Eventhouse database and has no visibility into pipeline or dataflow run status at all. In practice, the supervisor should open the Monitoring hub, filter to failed or long-running items from the overnight window, and drill into any flagged run for detail before deciding whether the morning's digitized batch is ready.