
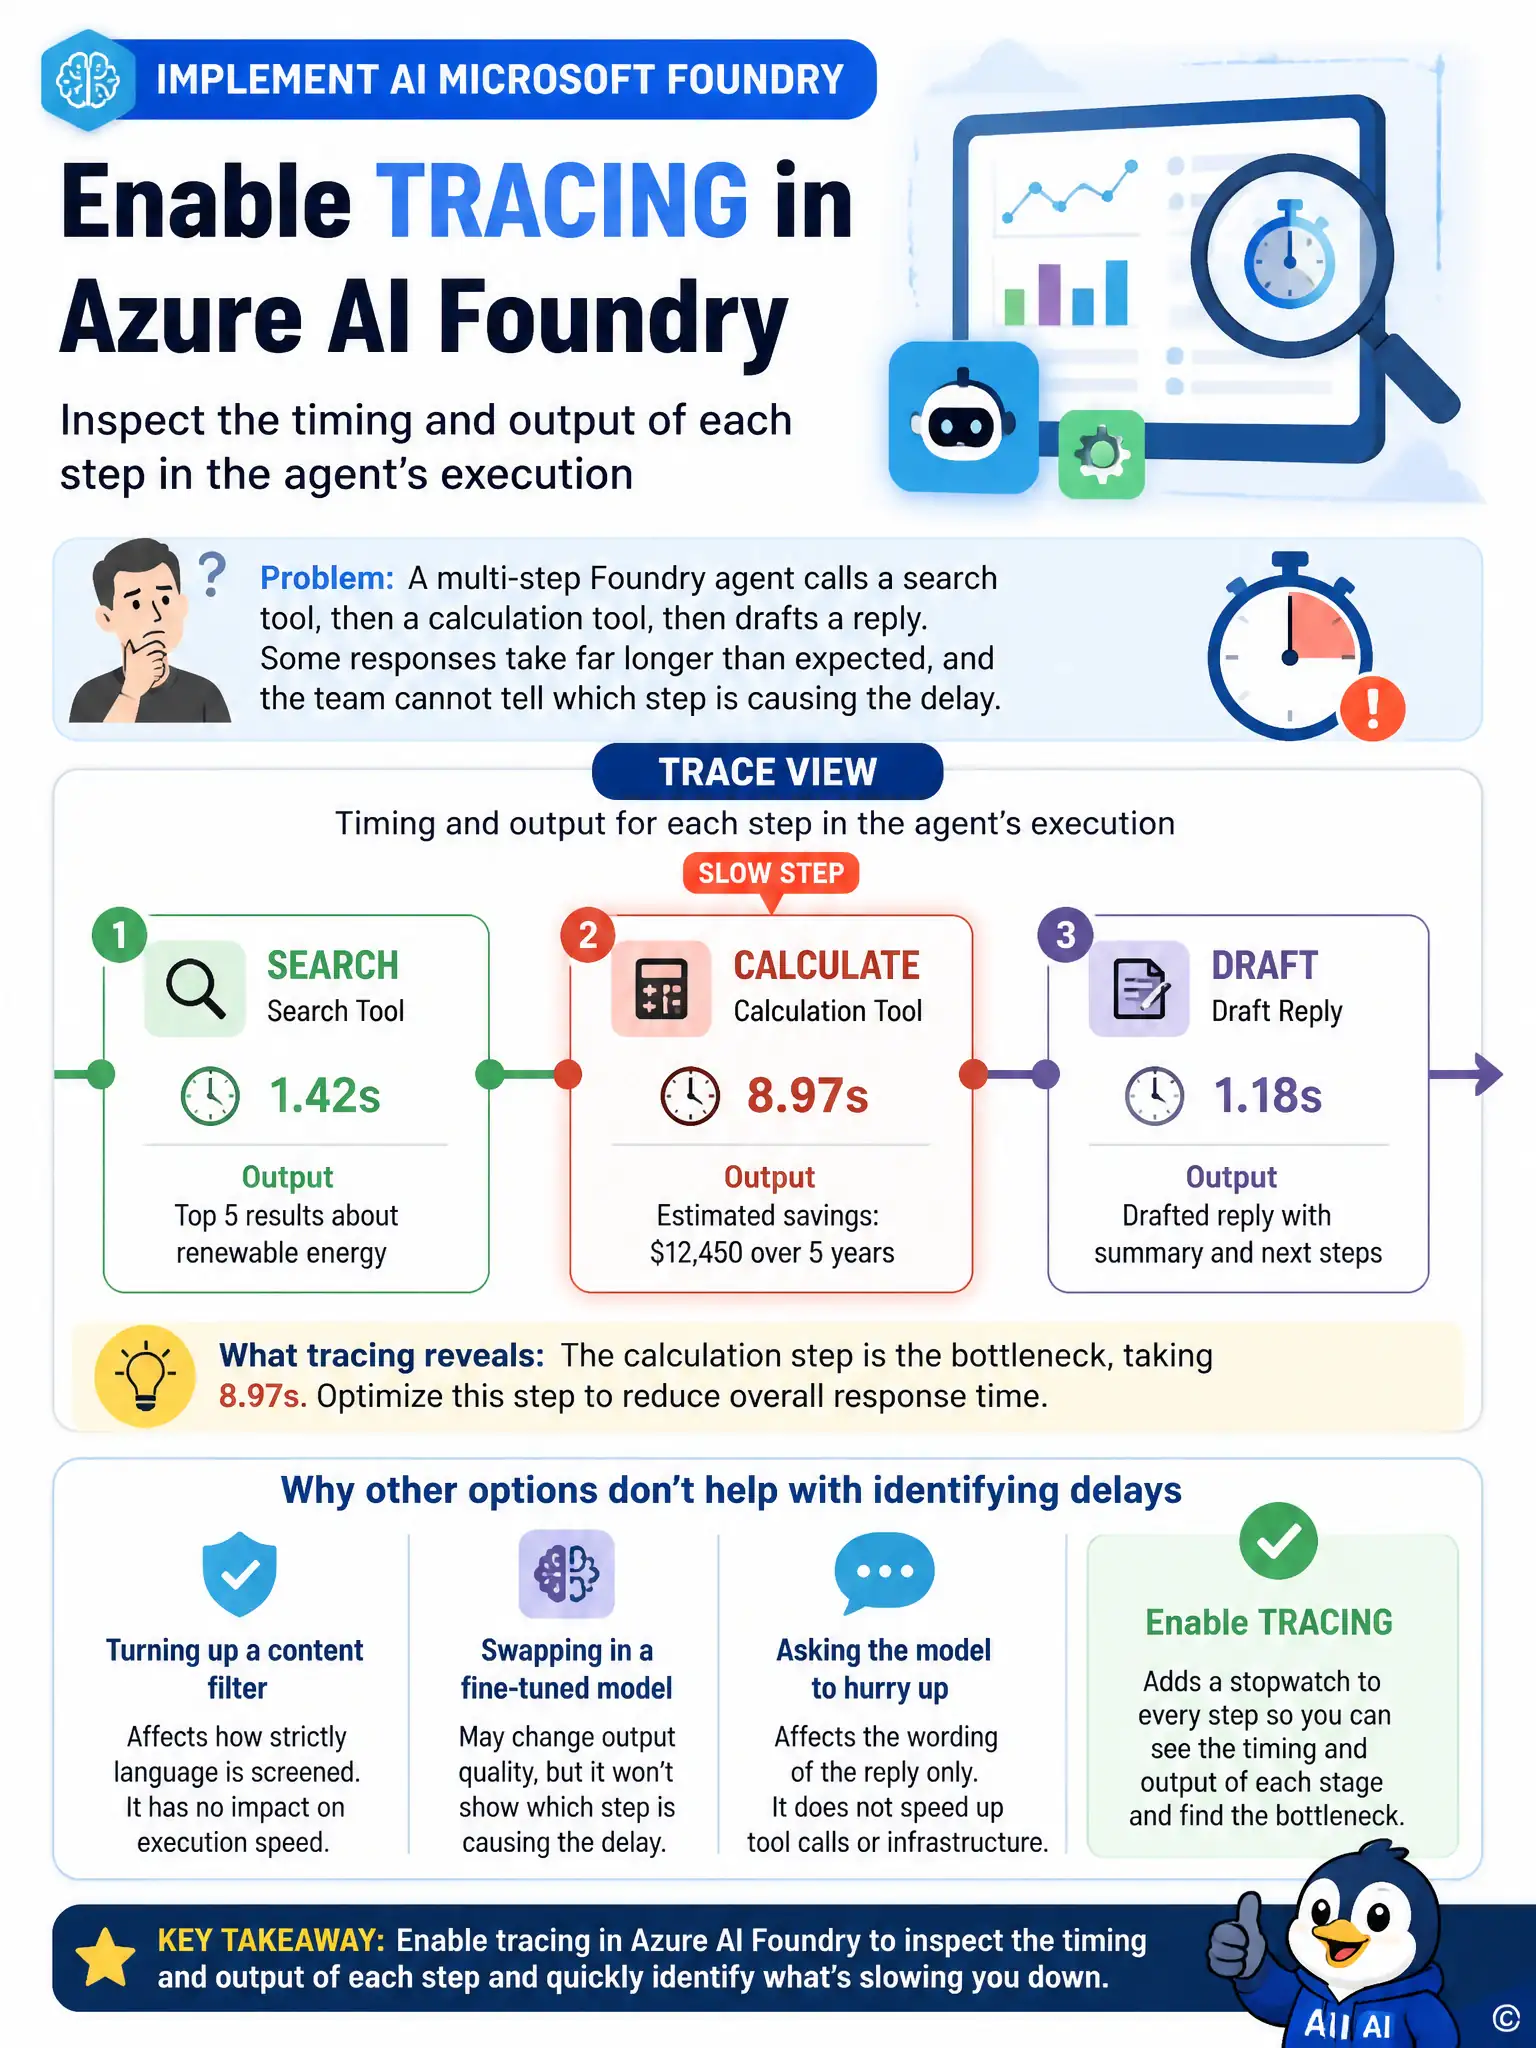
A team built a multi-step Foundry agent that calls a search tool, then a calculation tool, then drafts a reply. In testing, some responses take far longer than expected, and the team cannot tell which step in the chain is responsible for the delay.
Select an answer to reveal the explanation.
Short Explanation
When a multi-step agent is slow, don't guess—turn on tracing in Azure AI Foundry and watch the timing and output of each step. That shows you whether search, calculation, or drafting is holding things up. Safety filters, fine-tuning, or asking the model to hurry won't reveal the bottleneck.
Full Explanation
The correct answer is enabling tracing in Azure AI Foundry to inspect the timing and output of each step in the agent's execution. Tracing records the timing, inputs, and outputs of each step, including individual tool calls, which lets the team see exactly which step in the search-then-calculate-then-draft chain is consuming the extra time. Increasing the content safety filter's severity setting is incorrect because content safety filter severity governs how strictly content is screened for policy violations; it has no effect on tool-call latency, and adjusting it would not reveal where time is being lost. Switching the underlying model to a fine-tuned version of the same base model is incorrect because fine-tuning changes how a model generates text based on learned examples, but it does not provide visibility into a multi-step agent's execution timeline, and swapping models without diagnosing the bottleneck first risks fixing nothing. Adding a system message asking the model to respond more quickly is incorrect because such a message has no mechanical effect on execution speed; it shapes the content and tone of a reply, not the runtime performance of tool calls or infrastructure.