
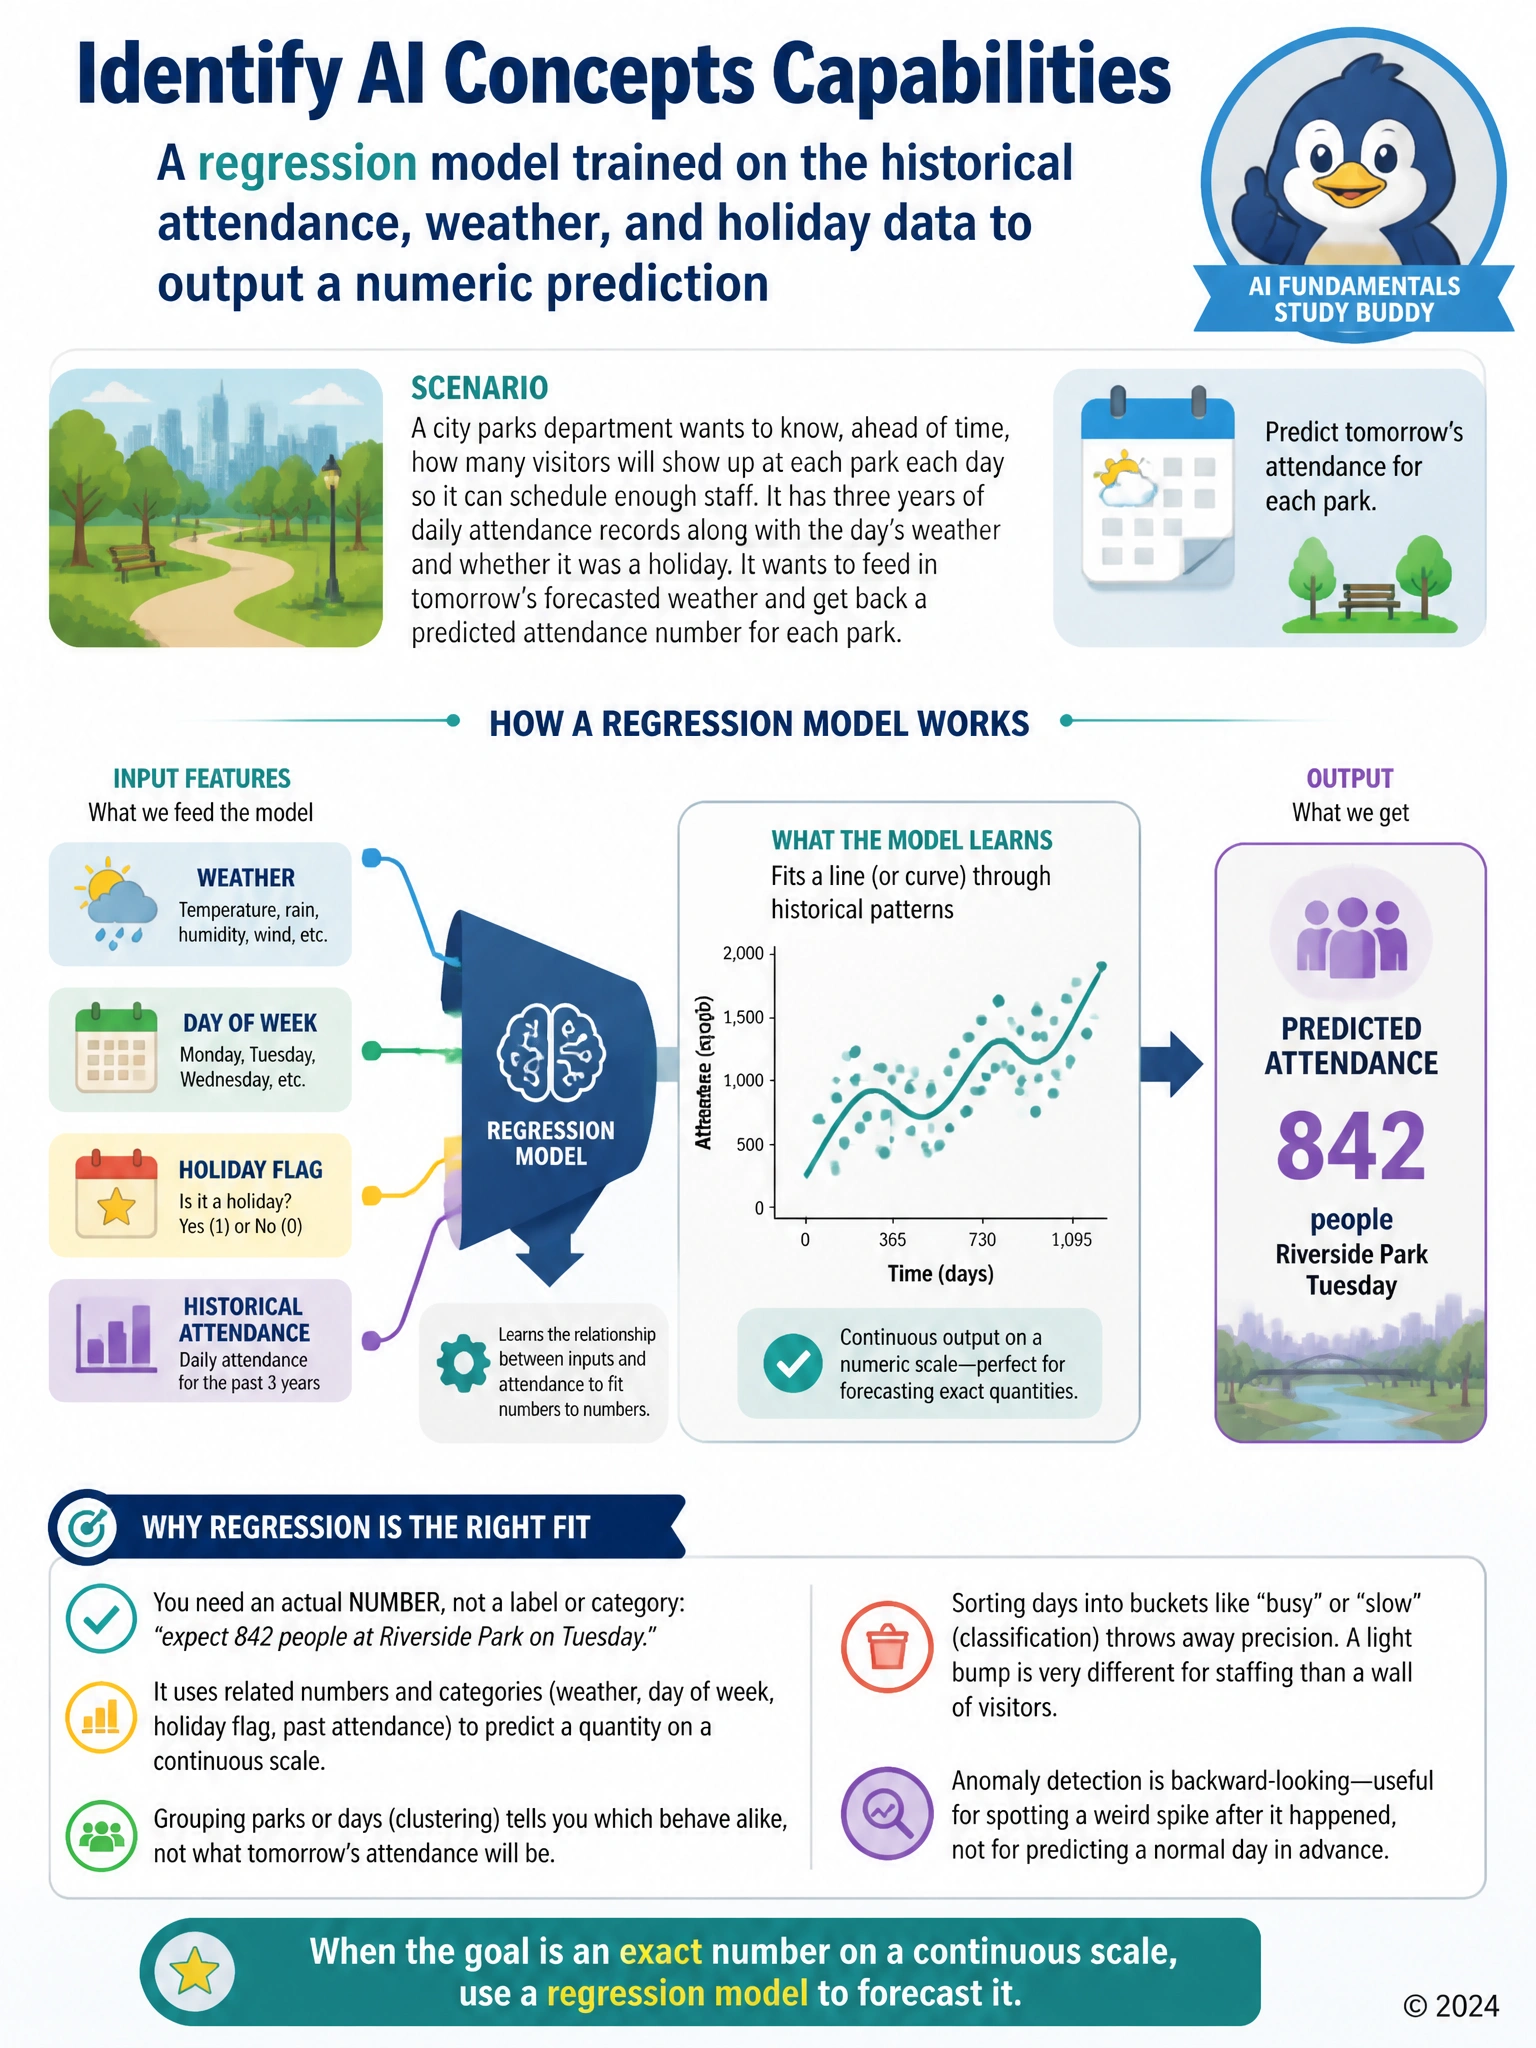
A city parks department wants to know, ahead of time, how many visitors will show up at each park each day so it can schedule enough staff. It has three years of daily attendance records along with the day's weather and whether it was a holiday. It wants to feed in tomorrow's forecasted weather and get back a predicted attendance number for each park. Which Azure AI Foundry capability best fits this need?
Select an answer to reveal the explanation.
Short Explanation
Think about what the parks department actually wants out at the end: not a label, not a group, but an actual number, like 'expect 842 people at Riverside Park on Tuesday.' Whenever the output you need is a quantity on a continuous scale, and you're feeding in related numbers and categories like weather and holiday flags to get there, you're looking at the forecasting flavor of machine learning that fits numbers to numbers. Sorting days into buckets like busy or slow would throw away the precision needed for staffing math, since a light bump is very different for staffing than a wall of visitors. Grouping parks by similarity is a different exercise entirely; it tells you which parks behave alike, not what tomorrow looks like at any one of them. And a technique built to flag days that broke the normal pattern is backward-looking by nature, useful for spotting a weird spike after it happened, not for staffing a perfectly ordinary Tuesday in advance.
Full Explanation
The correct answer is A. The department needs a specific numeric forecast, attendance count for a specific day at a specific park, produced from continuous historical data plus predictor variables like weather and holiday status. That is exactly the regression task: learning a function that maps inputs to a continuous output. Option B is incorrect because classification would only sort days into discrete buckets like 'low' or 'high' attendance, losing the precise headcount the department needs for staffing decisions. Option C is incorrect because clustering is an unsupervised technique for discovering groupings among parks themselves, such as parks with similar visitor patterns, not for predicting a future number for a specific day. Option D is incorrect because anomaly detection identifies unusual days that don't fit the normal pattern; it is useful for spotting outliers after the fact but does not produce a forward-looking staffing forecast for an ordinary day.