
Litware's platform team must specify observability for a multi-agent loan underwriting system spanning orchestrator, credit-check agent, and document agent across Azure services. Incidents require reconstructing why an agent chose a tool and replaying runs for debugging. Which observability component set should they specify?
Select an answer to reveal the explanation.
Short Explanation
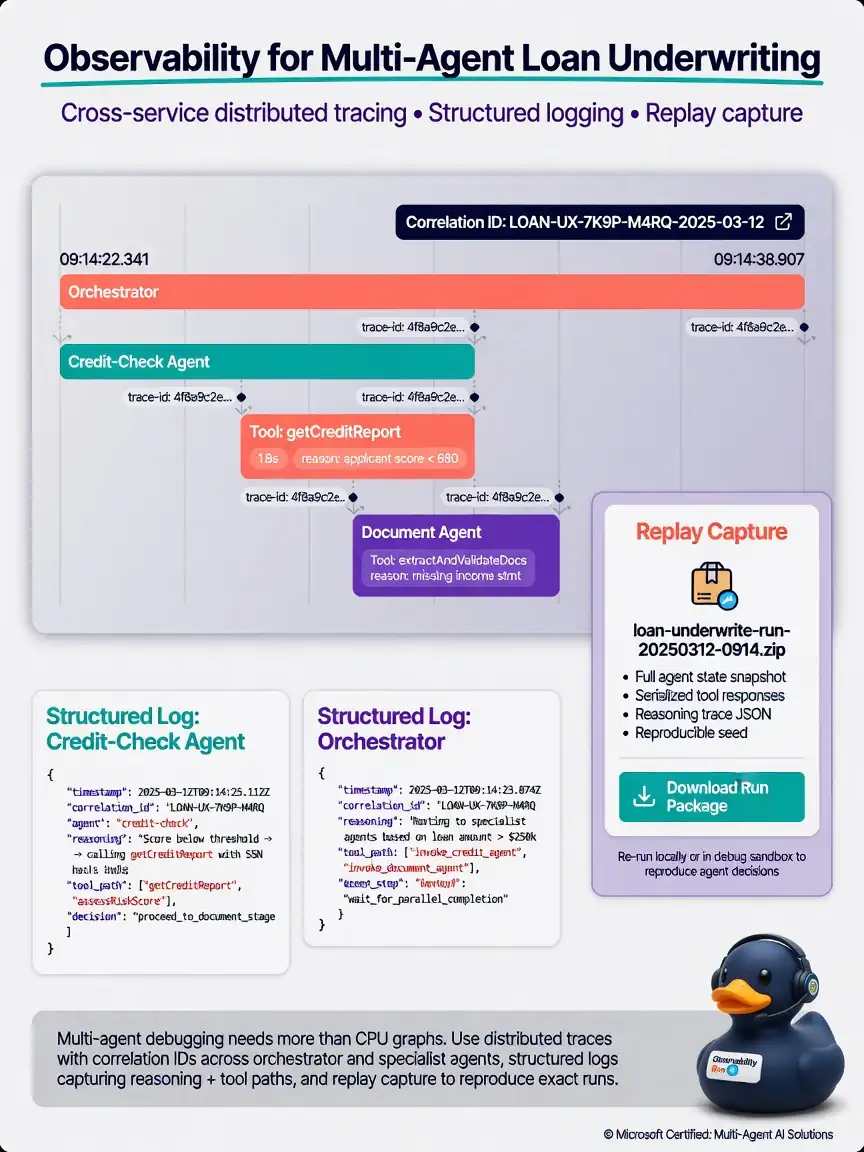
Multi-agent debugging needs more than CPU graphs. You want distributed traces with correlation IDs across orchestrator and specialists, structured logs of reasoning/tool paths, and replay capture so you can reproduce bad runs. Platform CPU only misses agent logic, printf soup won't scale or correlate, and one VM free-text log breaks distributed, multi-service reality.
Full Explanation
AI-500 observability components include cross-service trace correlation, structured logging of agent reasoning paths, and agent replay capture. The correct set—cross-service distributed tracing with correlation IDs, structured logging of agent reasoning and tool paths, and agent replay capture for reproducible debugging—enumerates exactly those capabilities. The Azure Monitor platform CPU metrics-only approach with no application-level agent telemetry is insufficient for agent quality and decision debugging. The console printf debugging approach in production containers without structured logs or correlation IDs lacks structure, correlation, retention controls, and production operability. The single shared log file on one VM capturing free-text agent thoughts with no trace IDs fails in multi-service Azure deployments and prevents joining events across agents. In Microsoft Foundry and Azure Monitor/Application Insights ecosystems, propagate correlation IDs through orchestrator → subagent → tool calls, log tool names/arguments/results with redaction, and store replayable run artifacts for offline analysis. Exam tip: If the stem mentions reconstructing decisions across services, choose tracing plus structured reasoning logs plus replay.