
A water-ops copilot dashboard shows p95 latency rising during morning SCADA report generation. Why does that percentile matter?
Select an answer to reveal the explanation.
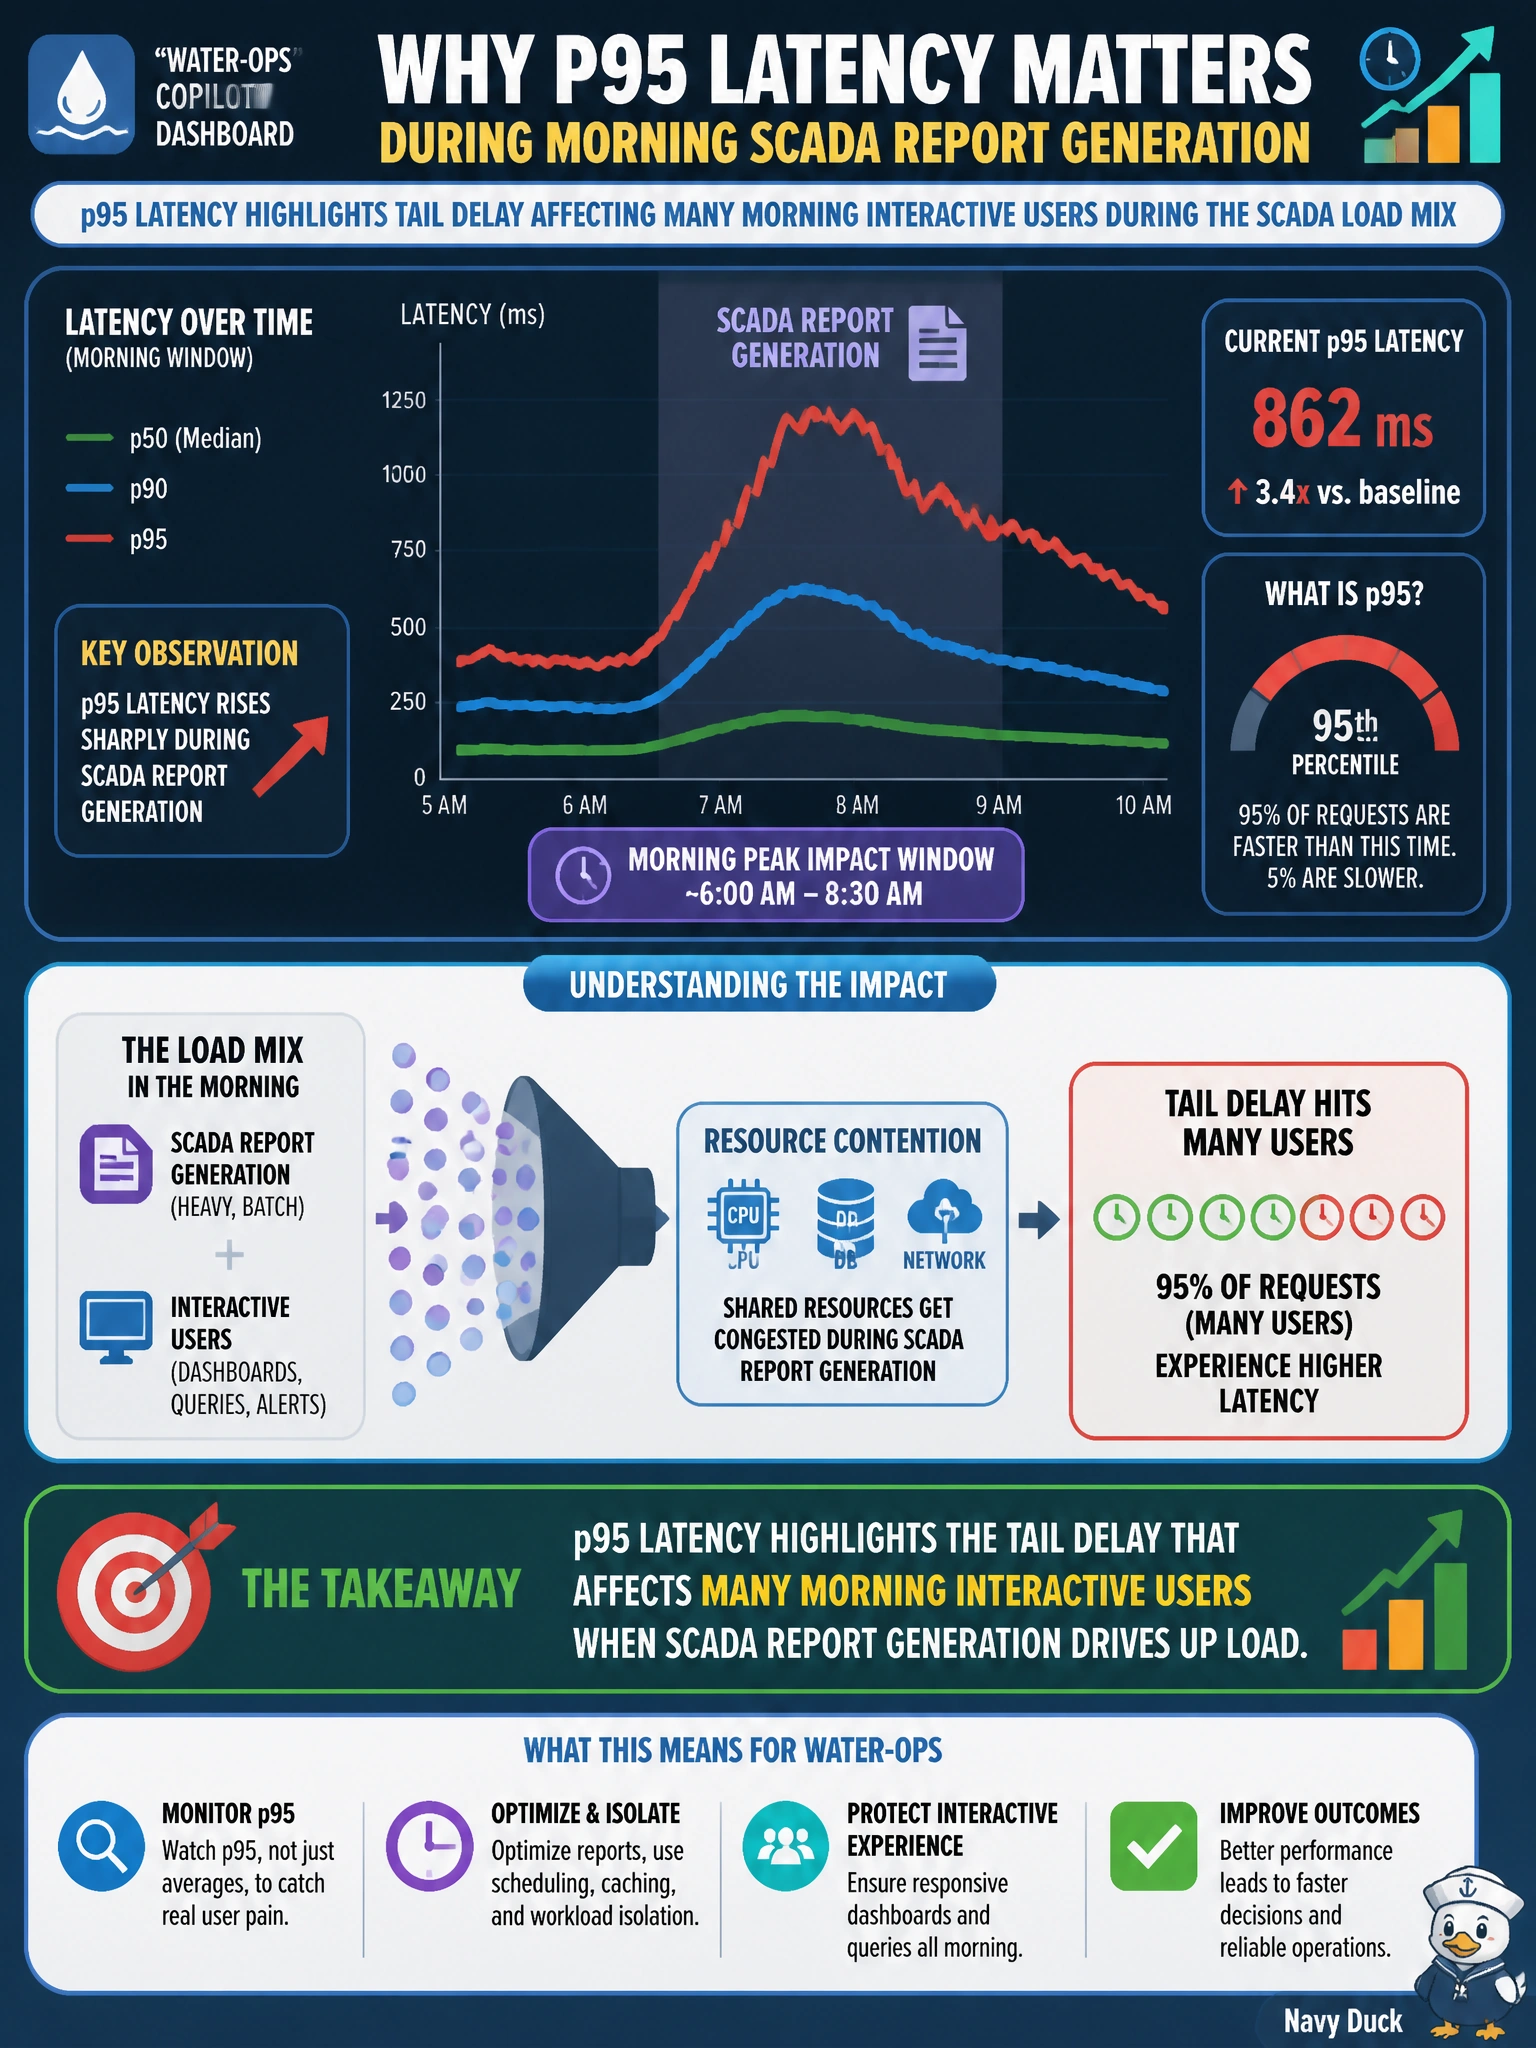
Short Explanation
You'll miss the real morning pain if you're only watching the top 1% of sensor timeouts. p95 shows that painful tail during SCADA report load.
Full Explanation
p95 latency highlighting tail delay affecting many morning interactive users during the SCADA load mix is correct because percentile latency shows what a large share of users experience, not just the lucky mean. When a water-ops copilot dashboard shows rising p95 during morning SCADA report generation, interactive operators share capacity with heavy batch report work; the tail of the latency distribution stretches even if some requests stay fast. p95 (and similar percentiles) make that tail delay visible so municipal ops can protect interactive SLOs under mixed load.
Claiming p95 latency isolates upper 1% sensor timeouts for morning users during SCADA report generation fails—p95 is the 95th percentile, so 5% of requests are slower, not 1%, and it describes overall interactive latency under the morning report mix, not just sensor timeouts. Claiming rising p95 reflects tail delay from overnight historian sync affecting morning users in the SCADA load mix misattributes the source and window; the stem ties the rising tail to contention during morning SCADA report generation, not to a leftover overnight sync job. Claiming p95 latency tracks tail delay for evening compliance exports during the morning SCADA load mix gets the population and time window wrong; the percentile in question is measured for morning interactive users under morning report load, not for evening export work.
Exam caveat: averages hide tails; p95/p99 expose them. Mixed batch and interactive municipal workloads often inflate tail latency—monitor percentiles against interactive SLOs, not only mean response time.
Operational check: chart p95 (and p99) for the water-ops copilot during morning SCADA windows, separate batch report traffic from interactive sessions where possible, apply isolation or scheduling so report jobs do not starve chat/copilot paths, and re-check percentiles after the change before declaring the morning SLO healthy.
Prefer to study offline? Printable PDF study book + test engine ($7.50, unofficial). These questions stay free here.