
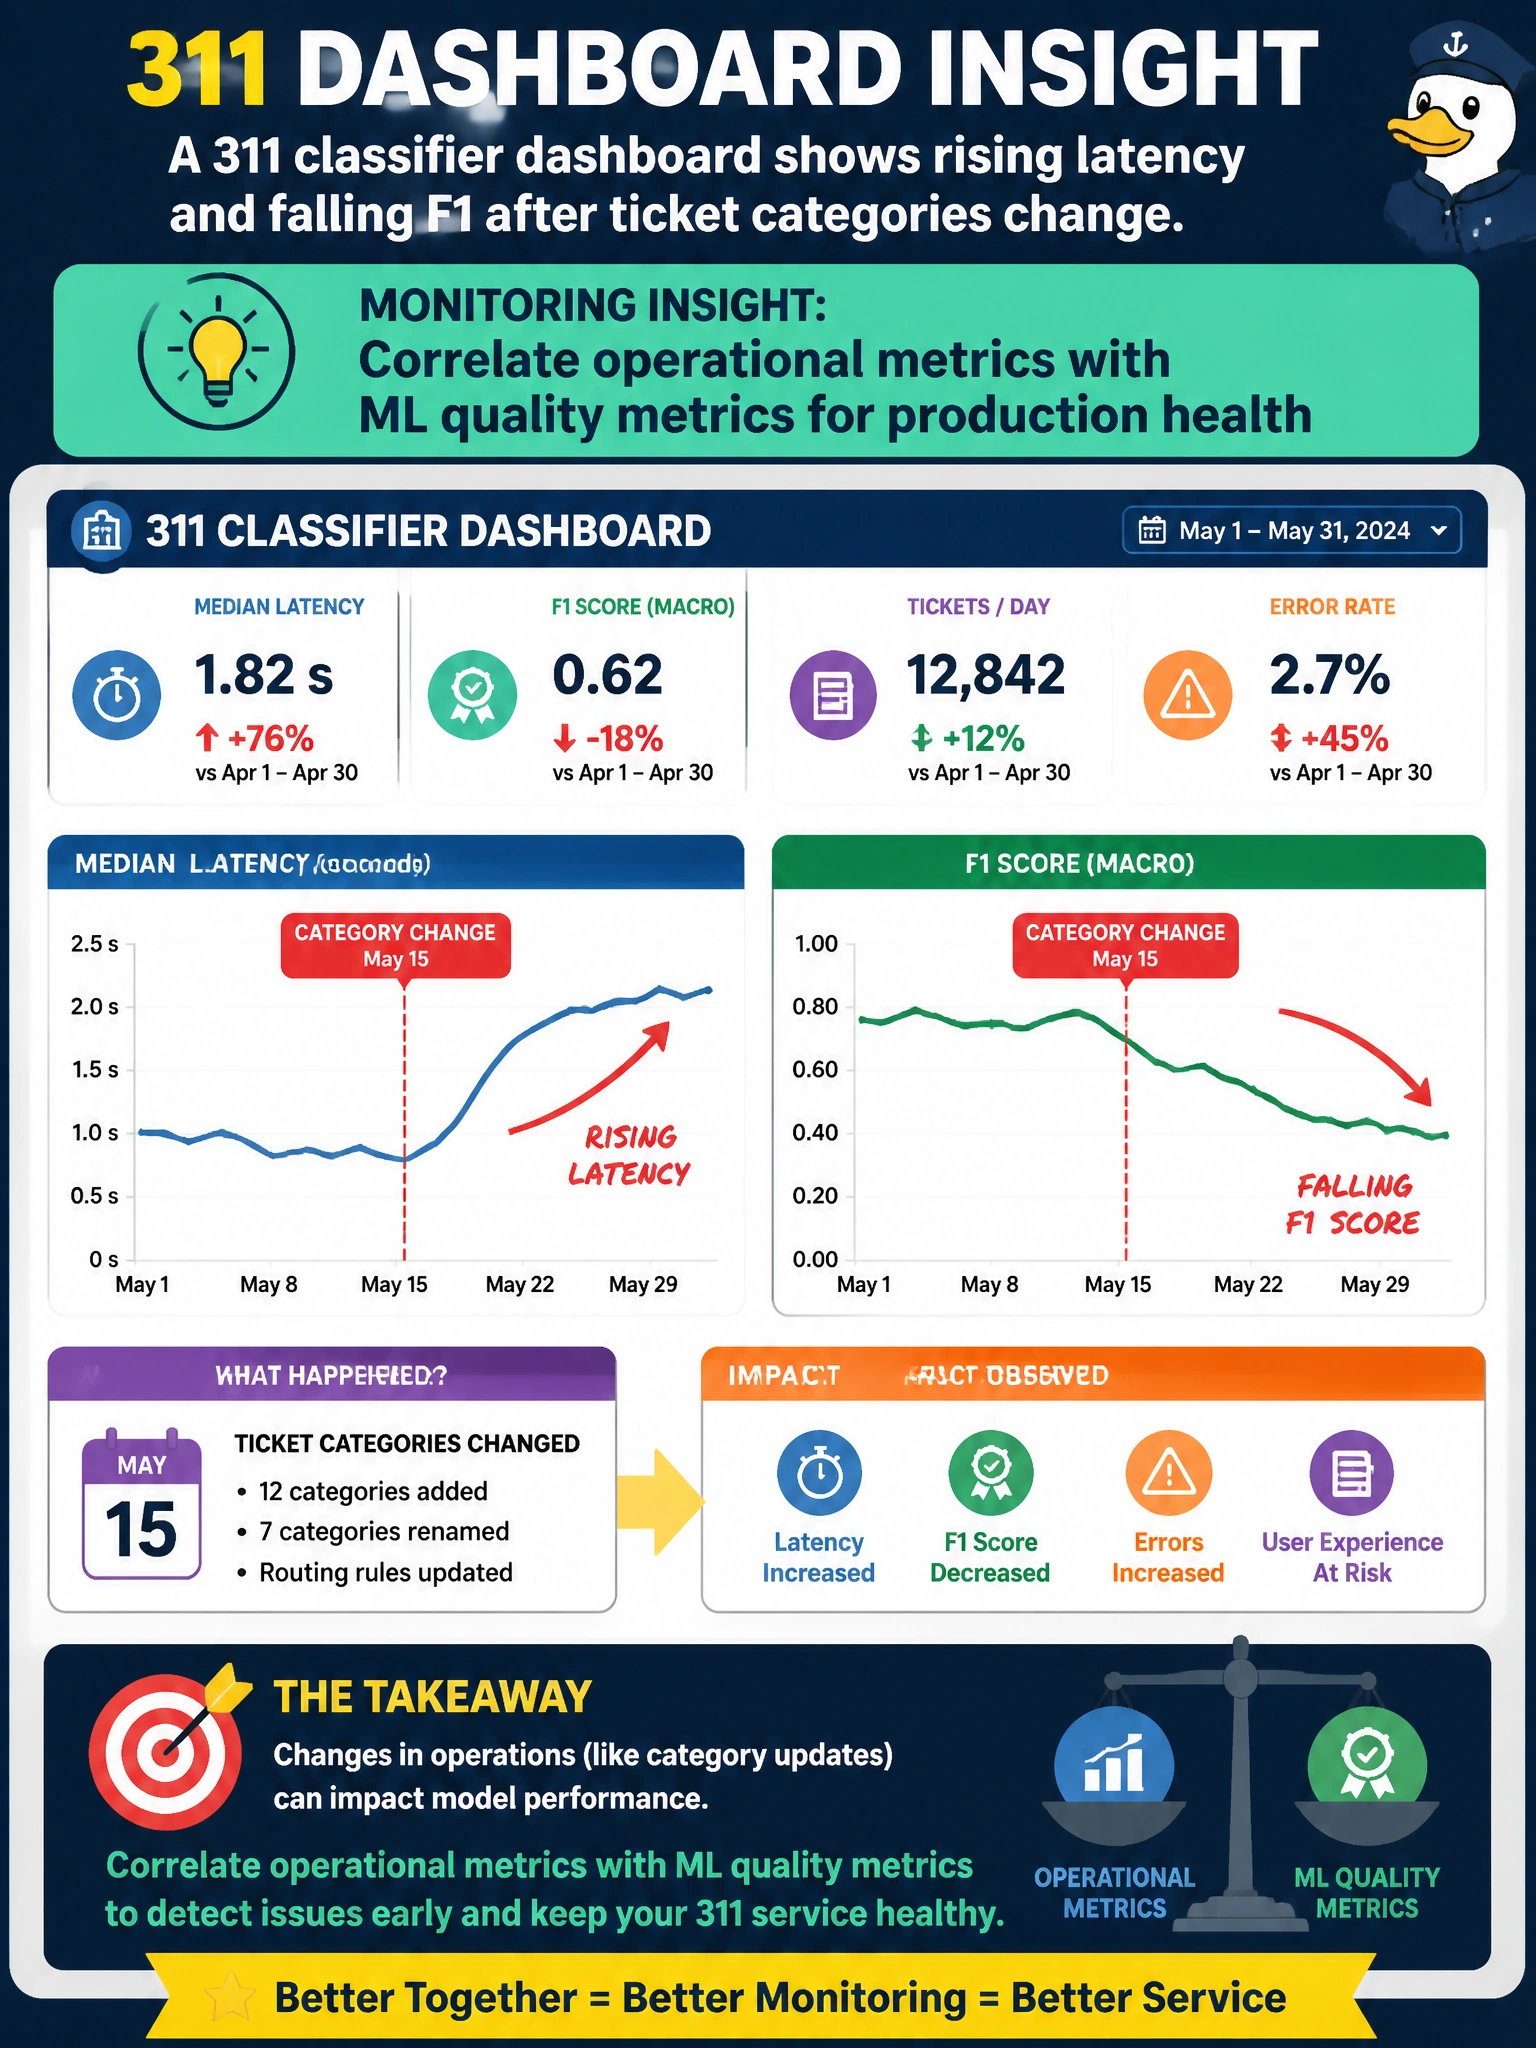
A 311 classifier dashboard shows rising latency and falling F1 after ticket categories change. What monitoring insight does this illustrate?
Select an answer to reveal the explanation.
Short Explanation
When categories shuffle, both the stopwatch and the F1 score can tank together. Read ops metrics next to ML metrics so you see the full 311 health picture.
Full Explanation
Correlating operational metrics with ML quality metrics for production health is the insight because rising latency and falling F1 after 311 ticket-category changes show joint regression across infrastructure and model quality. Taxonomy shifts can increase processing cost, change class balance, and degrade classification performance simultaneously. Municipal monitoring that places latency (and related ops signals) next to F1 (and related ML metrics) reveals the full health picture that siloed dashboards miss.
Isolating inference latency in service dashboards to guide capacity scaling decisions fails because it treats latency as a siloed infrastructure concern; without F1 alongside it, operators can't see that both are regressing together from the taxonomy change, and scaling capacity won't fix misrouted tickets. Comparing offline validation F1 against live F1 for distribution shift fails because it looks only at ML quality in isolation; even if a gap reveals drift, it ignores the concurrent latency increase and doesn't reveal the joint operational-model regression that explains the dashboard's health. Triggering automated retraining when F1 drops after schema updates fails because it jumps to remediation before diagnosing whether latency and quality share a root cause in the taxonomy change; blind retraining risks degrading the model further while the operational signal goes unexamined.
Exam caveat: stems that show both ops and ML metrics moving after a taxonomy or application change want correlation of those metric classes—not single-metric tunnel vision or concealment.
Operational check: on the 311 classifier dashboard, place latency/error-rate panels beside F1/precision-recall, annotate the category-change date, verify both series are monitored with alerts, and require joint review when either side regresses after taxonomy updates.
Prefer to study offline? Printable PDF study book + test engine ($7.50, unofficial). These questions stay free here.