
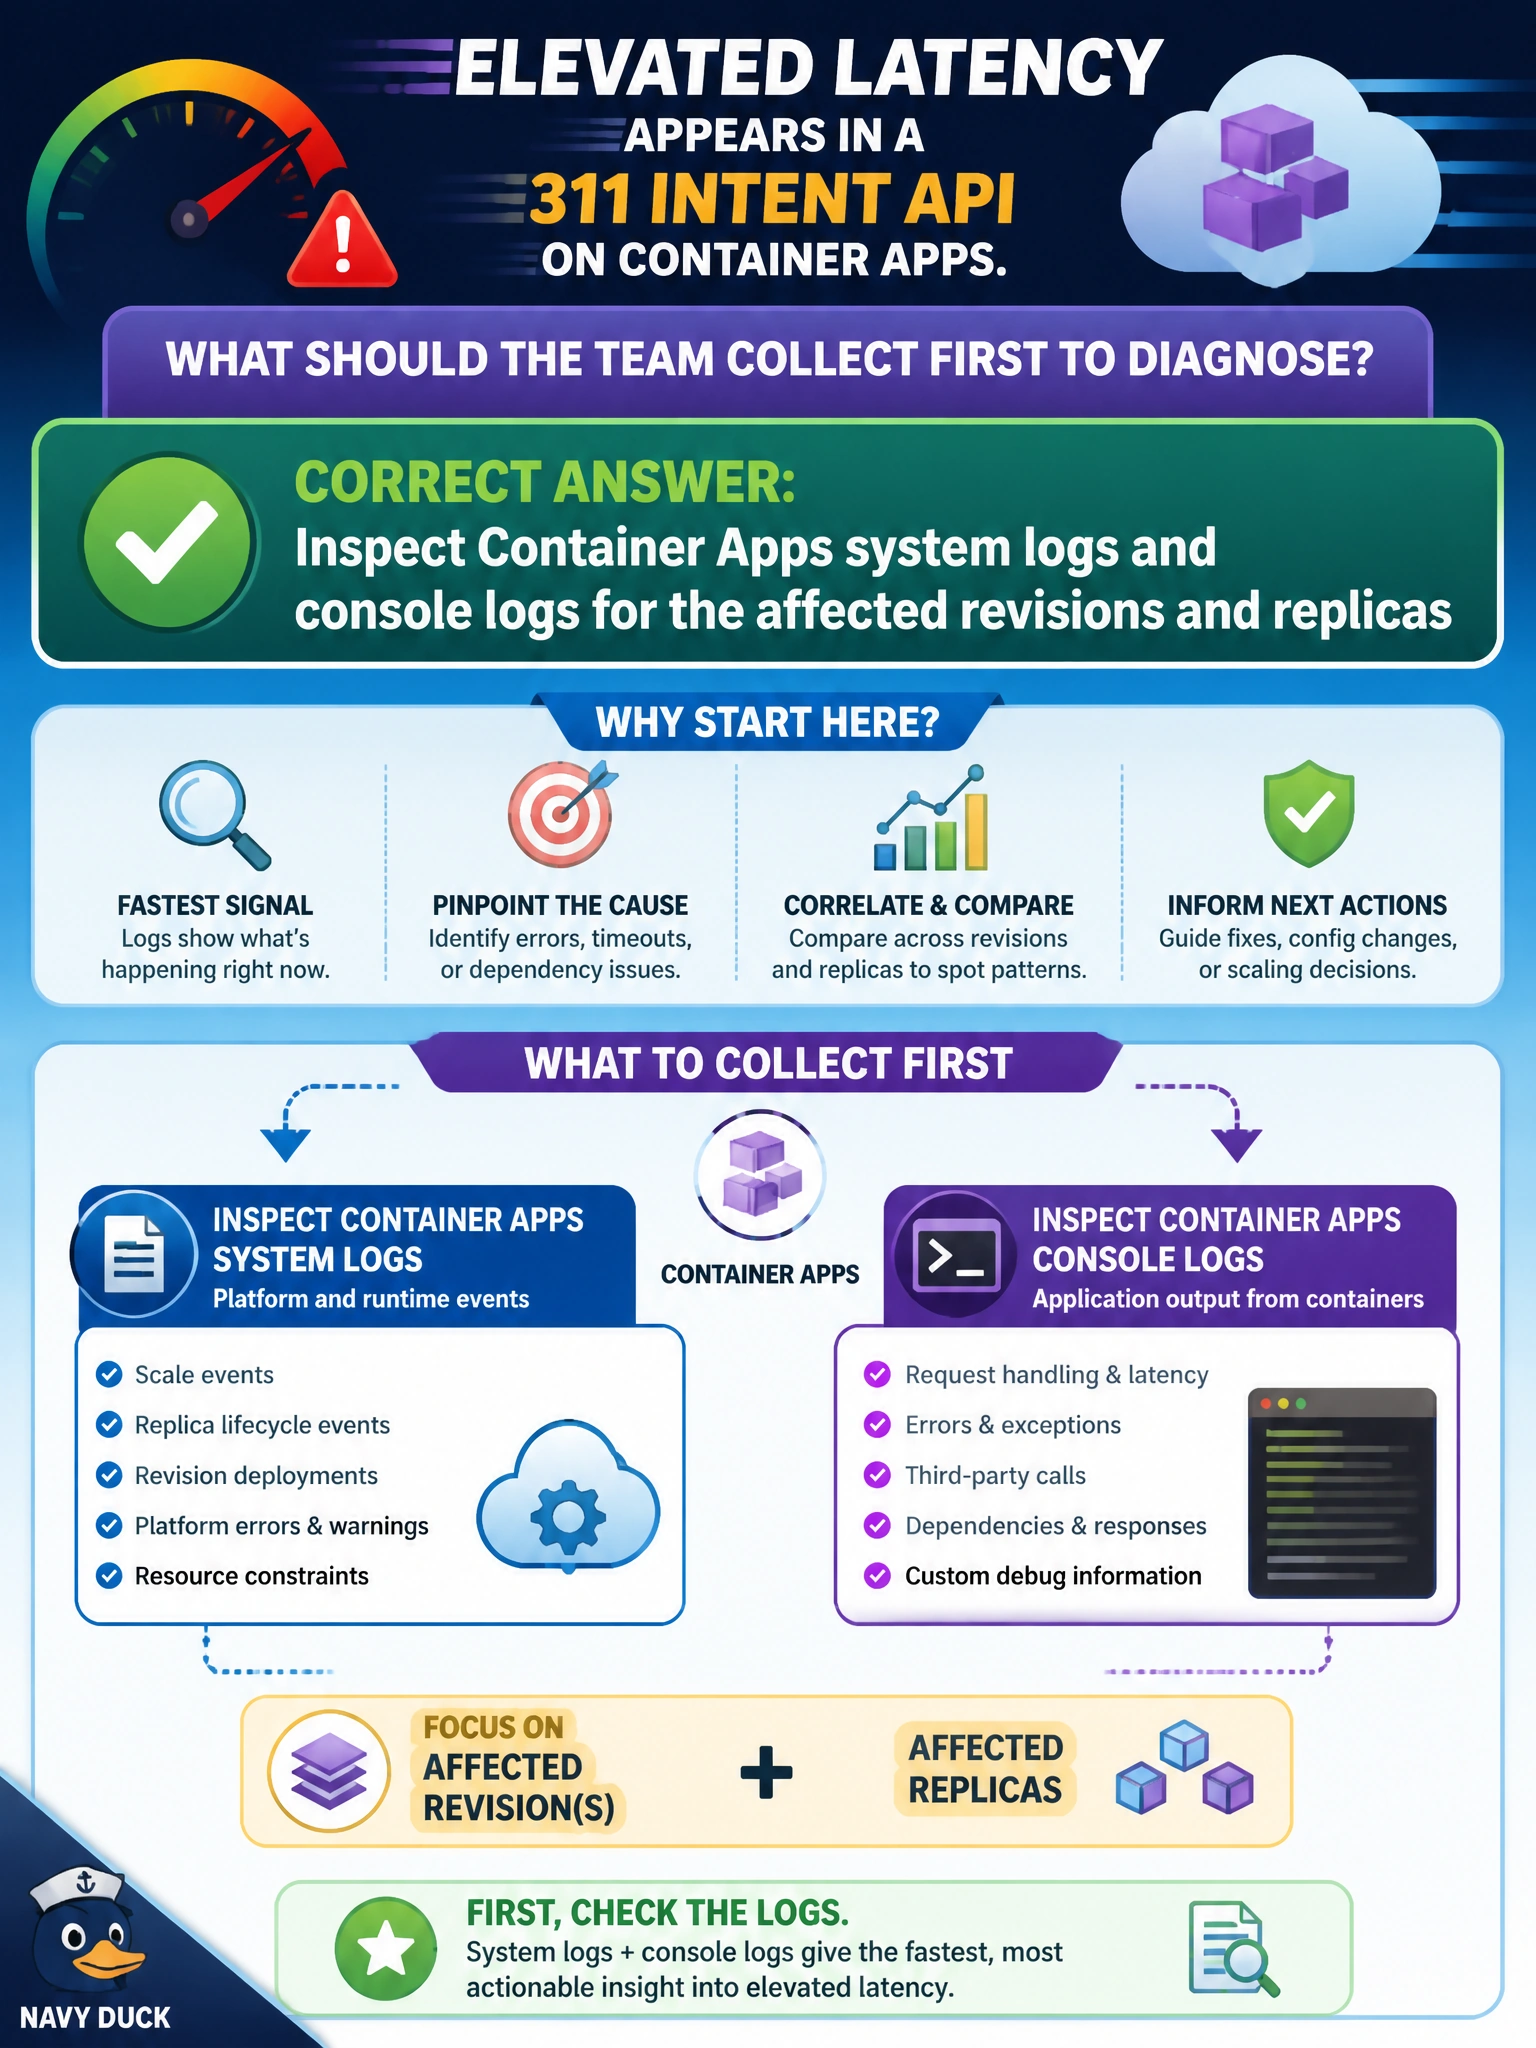
Elevated latency appears in a 311 intent API on Container Apps. What should the team collect first to diagnose?
Select an answer to reveal the explanation.
Short Explanation
When your 311 intent API gets sluggish, start with evidence: inspect Container Apps system and console logs for the affected revisions and replicas. You can trace errors or slow calls before changing capacity or swapping in a mock service.
Full Explanation
Elevated latency on a 311 intent API calls for evidence first: inspect Container Apps system and console logs for the affected revisions and replicas to find errors, dependency timeouts, cold starts, or resource saturation. Logs correlate symptoms with possible causes before you change capacity or models. For municipal operations, this evidence-first approach prevents expensive guesswork during resident-facing incidents. Ignoring logs and immediately doubling every replica count may mask or miss the real fault, such as a bad dependency, misconfiguration, or lock contention, while increasing cost. Swapping the intent model for a lightweight mock service changes the system being measured; a response-time comparison may not systematically identify the latency source or reflect real product behavior. Disabling logging removes key telemetry needed to correlate latency with errors or slow calls. Exam caveat: logs are the first stop, not the only stop—metrics and traces matter too. Distinguish revision-level from replica-level issues, and keep production logging enabled for civic incident response. Practical check: open Container Apps logs for the high-latency revision, filter to the incident window, look for error bursts or slow dependency calls, form a hypothesis, apply a targeted fix, and remeasure 311 intent latency. Preserve log retention for after-action review.