
A Copilot Studio agent handles multi-step insurance claim submissions. Your monitoring team reports that 40% of sessions that begin the claim process never reach the final confirmation step. Application Insights is connected to the agent. You want to identify exactly which conversational step users abandon most often and visualize the drop-off sequence. Which Application Insights capability should you configure?
Select an answer to reveal the explanation.
Short Explanation and Infographic
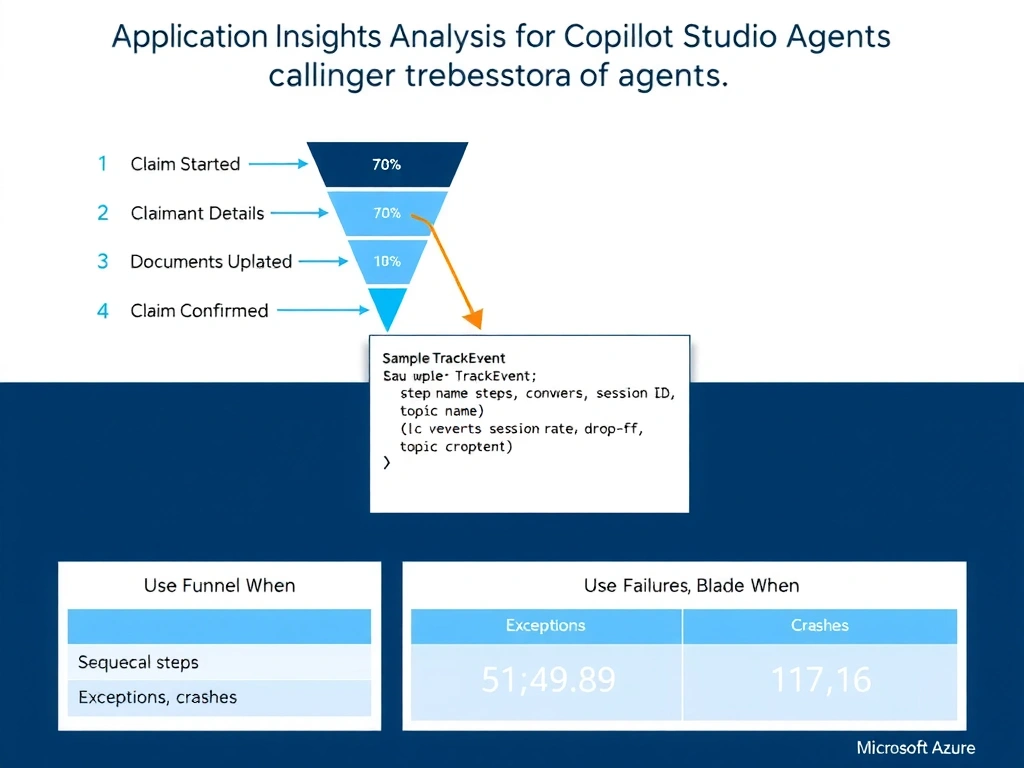
Think of a funnel analysis like a hallway with doors — it shows you exactly which door people are walking through and which one they're slamming shut behind them. Funnel analysis in Application Insights takes ordered custom events (your claim steps) and measures how many users make it through each gate, making the exact drop-off point crystal clear.
Full explanation below image
Full Explanation
Application Insights Funnel analysis is purpose-built for exactly this scenario: you have a sequential, multi-step process and you need to know where users exit. By emitting a custom event at each conversational step — for example, 'ClaimStarted', 'ClaimantInfoCollected', 'DamageDetailsEntered', 'DocumentsUploaded', 'ClaimConfirmed' — you create discrete, ordered signals that Funnel can consume as stages. The analysis then shows you the percentage of users who progress from each stage to the next, making drop-off rates immediately visible.
To emit custom events from a Copilot Studio agent, you configure the Application Insights integration and use Power Automate flows or custom connectors to call the Application Insights API with TrackEvent calls. Each event carries properties like session ID, topic name, and step number so the funnel can filter and segment accurately.
Option A (Failures blade with exception traces) is wrong because users abandoning a conversation is not an exception — it is a silent exit. The Failures blade surfaces HTTP errors and unhandled exceptions, not intentional or passive session terminations. Grouping by cloud_RoleName identifies the service component, not the conversational drop-off point.
Option C (Live Metrics) is wrong because Live Metrics is a real-time operational view for spotting spikes or outages — it is not designed for sequential conversion analysis. It cannot show you cumulative session progression across a multi-step flow over historical time periods.
Option D (Availability tests) is wrong because Availability tests ping endpoints on a schedule to verify uptime. The Direct Line endpoint being up or down tells you nothing about within-session user behavior or which claim step triggers abandonment.
Exam tip: When a question describes a multi-step process with unknown exit points and asks for a visualization of drop-off, 'Funnel analysis with custom events' is almost always the correct Application Insights answer. Remember that custom events must be explicitly emitted — they do not appear automatically from Copilot Studio telemetry.