
An operations team wants a single place to analyse telemetry from a production environment's model-driven apps, Dataverse plug-in executions and cloud flow runs, with their own retention and custom queries. The environment is a managed environment. What should the developer design?
Select an answer to reveal the explanation.
Short Explanation
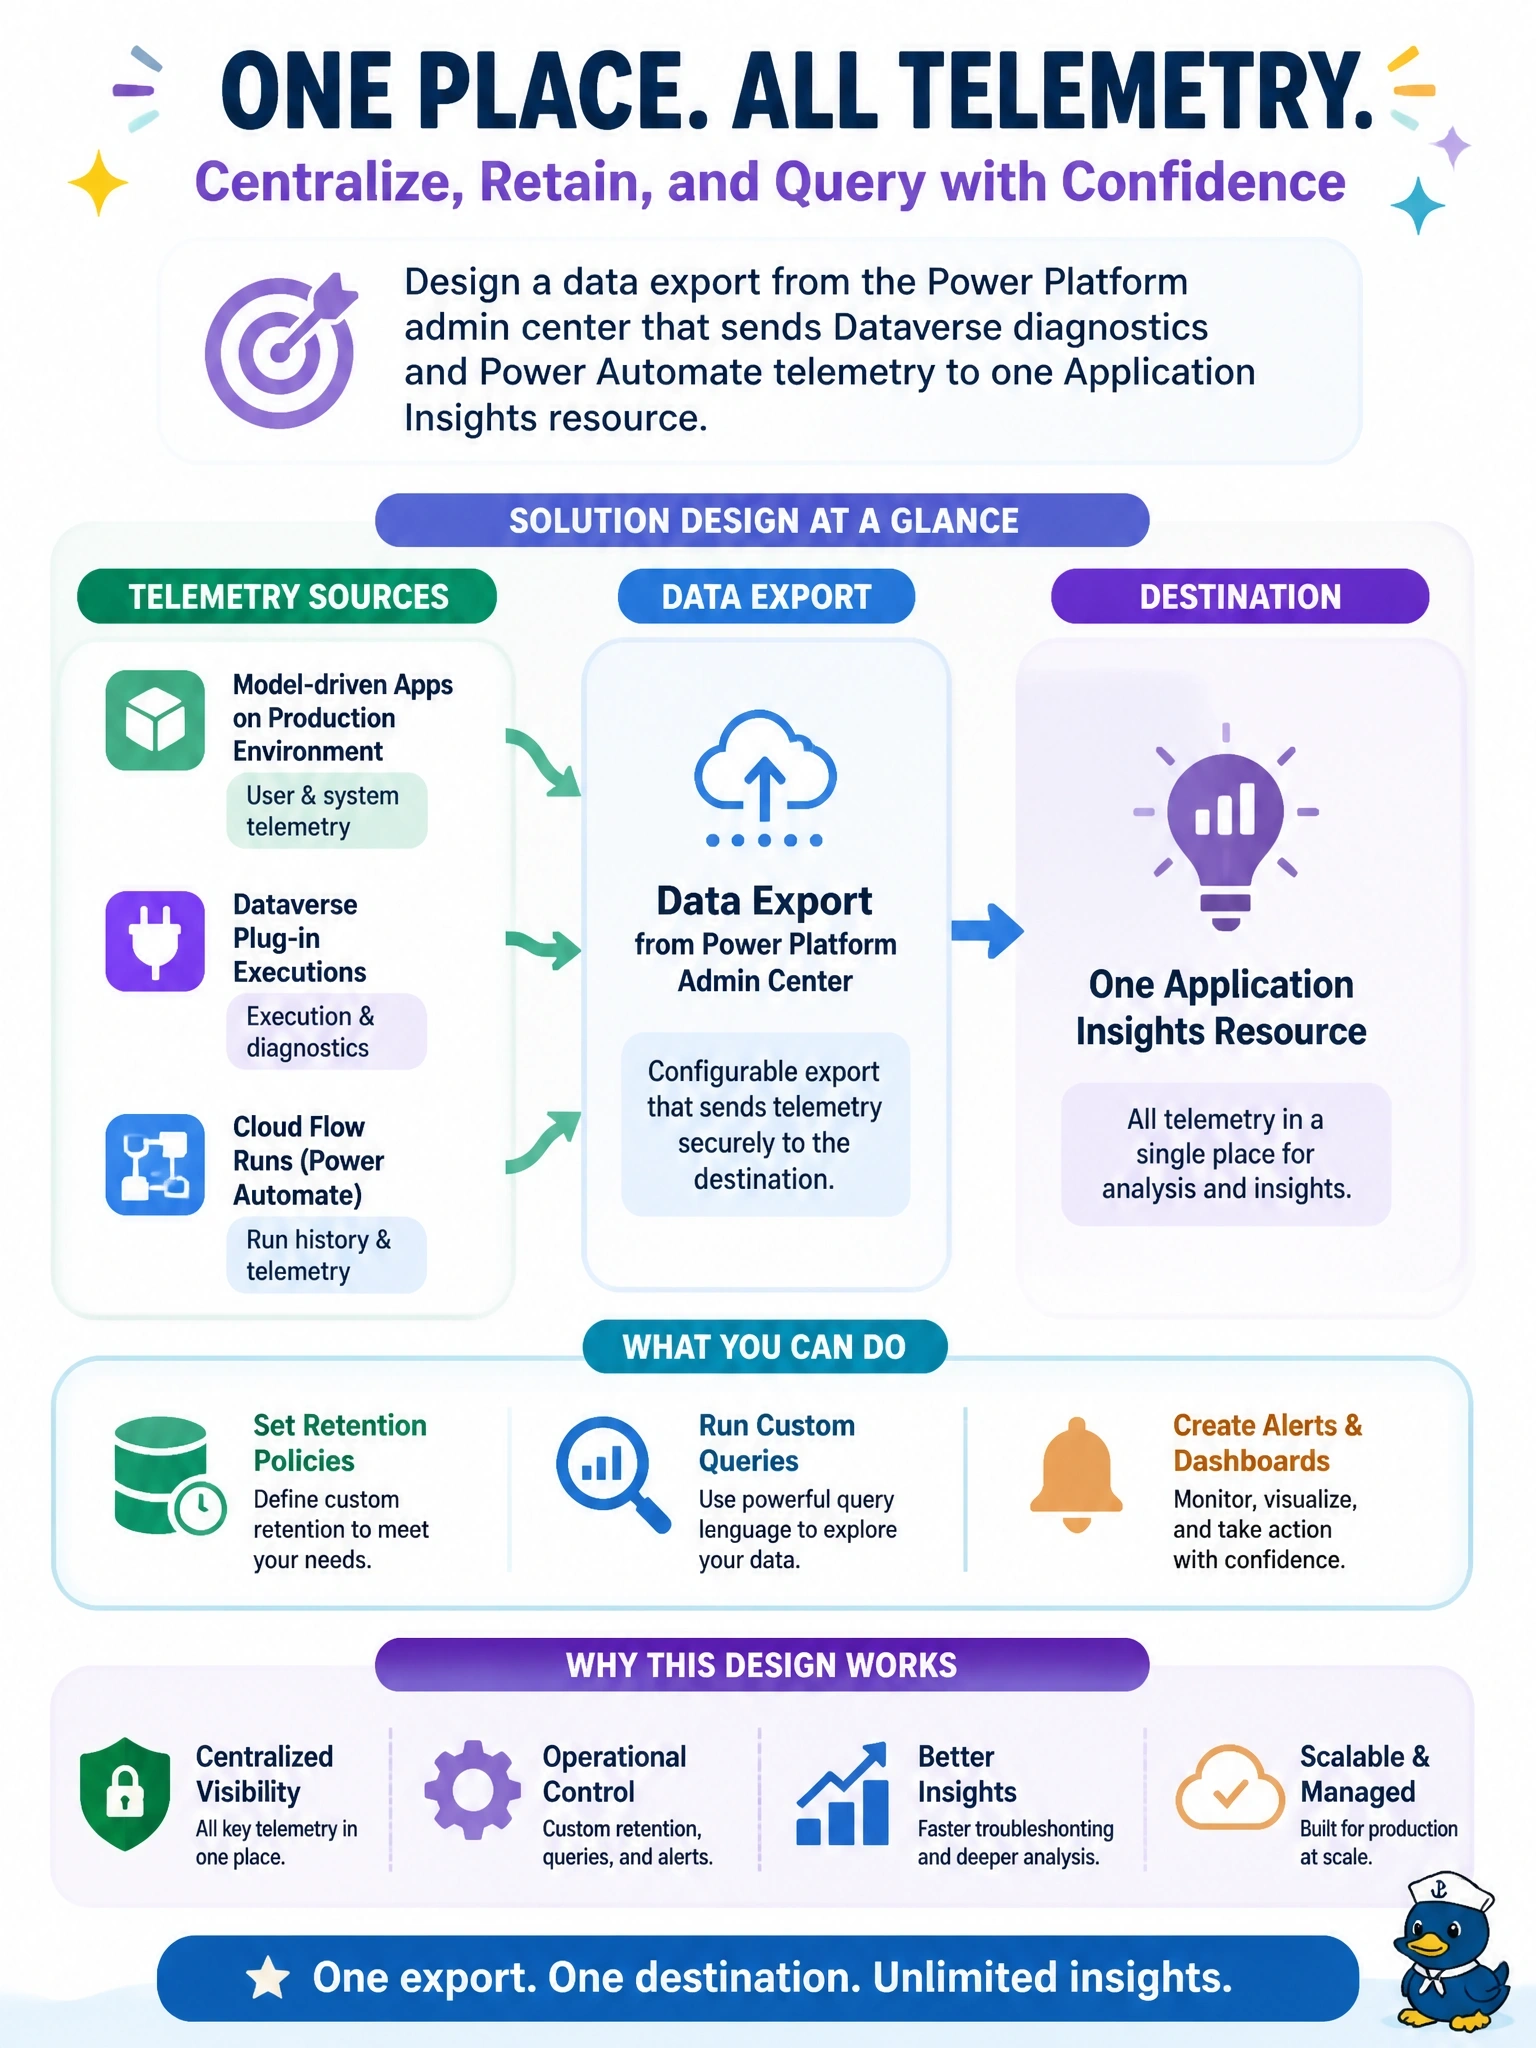
Think of Application Insights as one control tower for every flight: apps, plug-ins and flows all report into the same screen. You set the export up once in the admin center and query it however you like. The trap is the plug-in trace log, which only sees one corner of the airport.
Full Explanation
Power Platform can export telemetry to Azure Monitor Application Insights through data export packages configured in the Power Platform admin center. A package selects data types such as Dataverse diagnostics and performance, which covers model-driven app and Dataverse activity including plug-in executions, and Power Automate telemetry for cloud flow runs, triggers and actions, and sends them to a chosen Application Insights resource. The team then uses Kusto queries, workbooks, alert rules and its own retention settings in one place. The feature is supported for managed environments, and Microsoft recommends a dedicated Application Insights resource per environment. The plug-in trace log captures traces only for plug-ins and custom workflow activities and is stored in Dataverse with limited retention, so it is not a central telemetry store for apps and flows. The Monitor tool captures a live session for troubleshooting a specific app; it is not continuous production telemetry. Auditing records data changes for compliance, not performance or failures, and exporting audit logs does not capture flow runs or app performance. Exam caveat: telemetry is delivered within a service level of 24 hours, so this is an analysis design rather than real-time paging. Operational check: create the export package, then confirm data appears in the expected tables in Application Insights.