
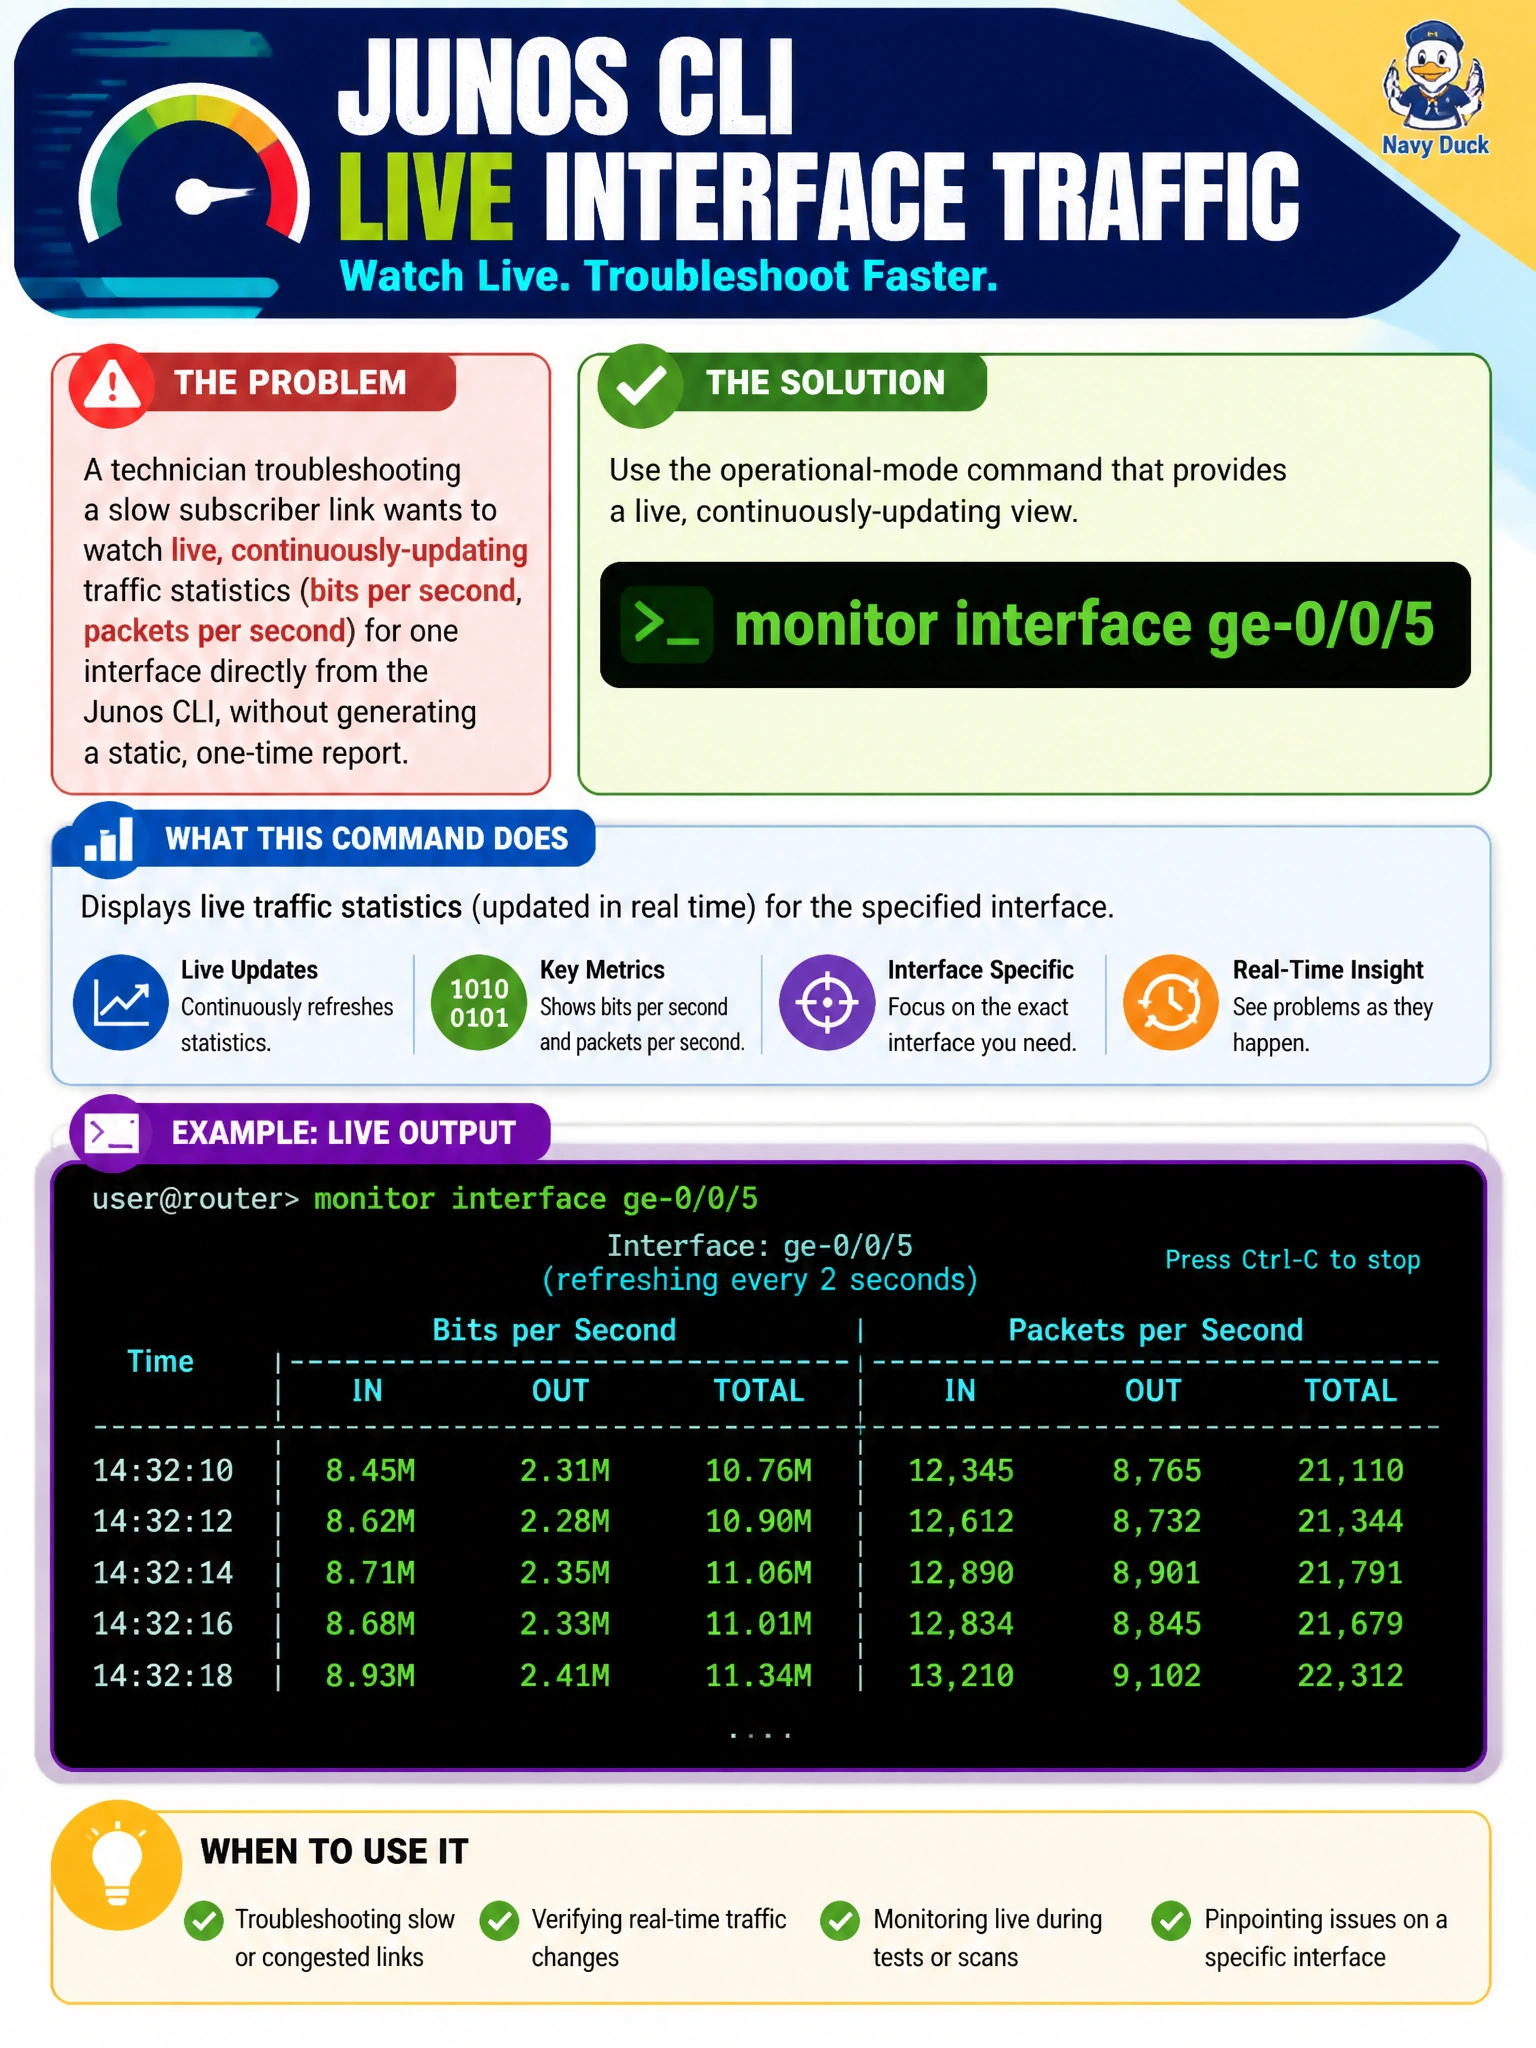
A technician troubleshooting a slow subscriber link wants to watch live, continuously-updating traffic statistics (bits per second, packets per second) for one interface directly from the Junos CLI, without generating a static, one-time report. Which operational-mode command provides that live view?
Select an answer to reveal the explanation.
Short Explanation
Think of monitor interface as opening a dashboard gauge that keeps moving in real time, versus show interfaces, which is more like a photograph taken the instant you press the button. When you need to watch a counter change while you're actively working the problem, the live gauge is the tool.
Full Explanation
monitor interface refreshes its display on an interval automatically, showing traffic rates and error counters updating on the screen without the operator re-issuing the command, which is exactly what's needed to watch behavior change in real time — for example while a technician on-site wiggles a suspect connector. show interfaces ge-0/0/5 and show interfaces extensive ge-0/0/5 both return a snapshot: accurate at the moment they're run, but static, so tracking a trend requires manually re-running the command and comparing outputs by hand. monitor traffic interface ge-0/0/5 is a real and closely related tool, but it operates one layer down — it captures and displays actual packet headers crossing the interface, similar to a lightweight sniffer, rather than presenting aggregate bandwidth and error rate counters. Choosing between the two monitor commands comes down to whether the question is "how much traffic and is it clean" (interface) or "what exactly is in the traffic" (traffic capture). One caveat: monitor interface output is only useful while the session stays open, so it isn't a substitute for logged historical data. A concrete check: leave monitor interface ge-0/0/5 running while reseating the suspect cable and watch whether the error rate visibly changes.