
Public works wants EVPN route-scale trends over months. Which analytics use case is that?
Select an answer to reveal the explanation.
Short Explanation
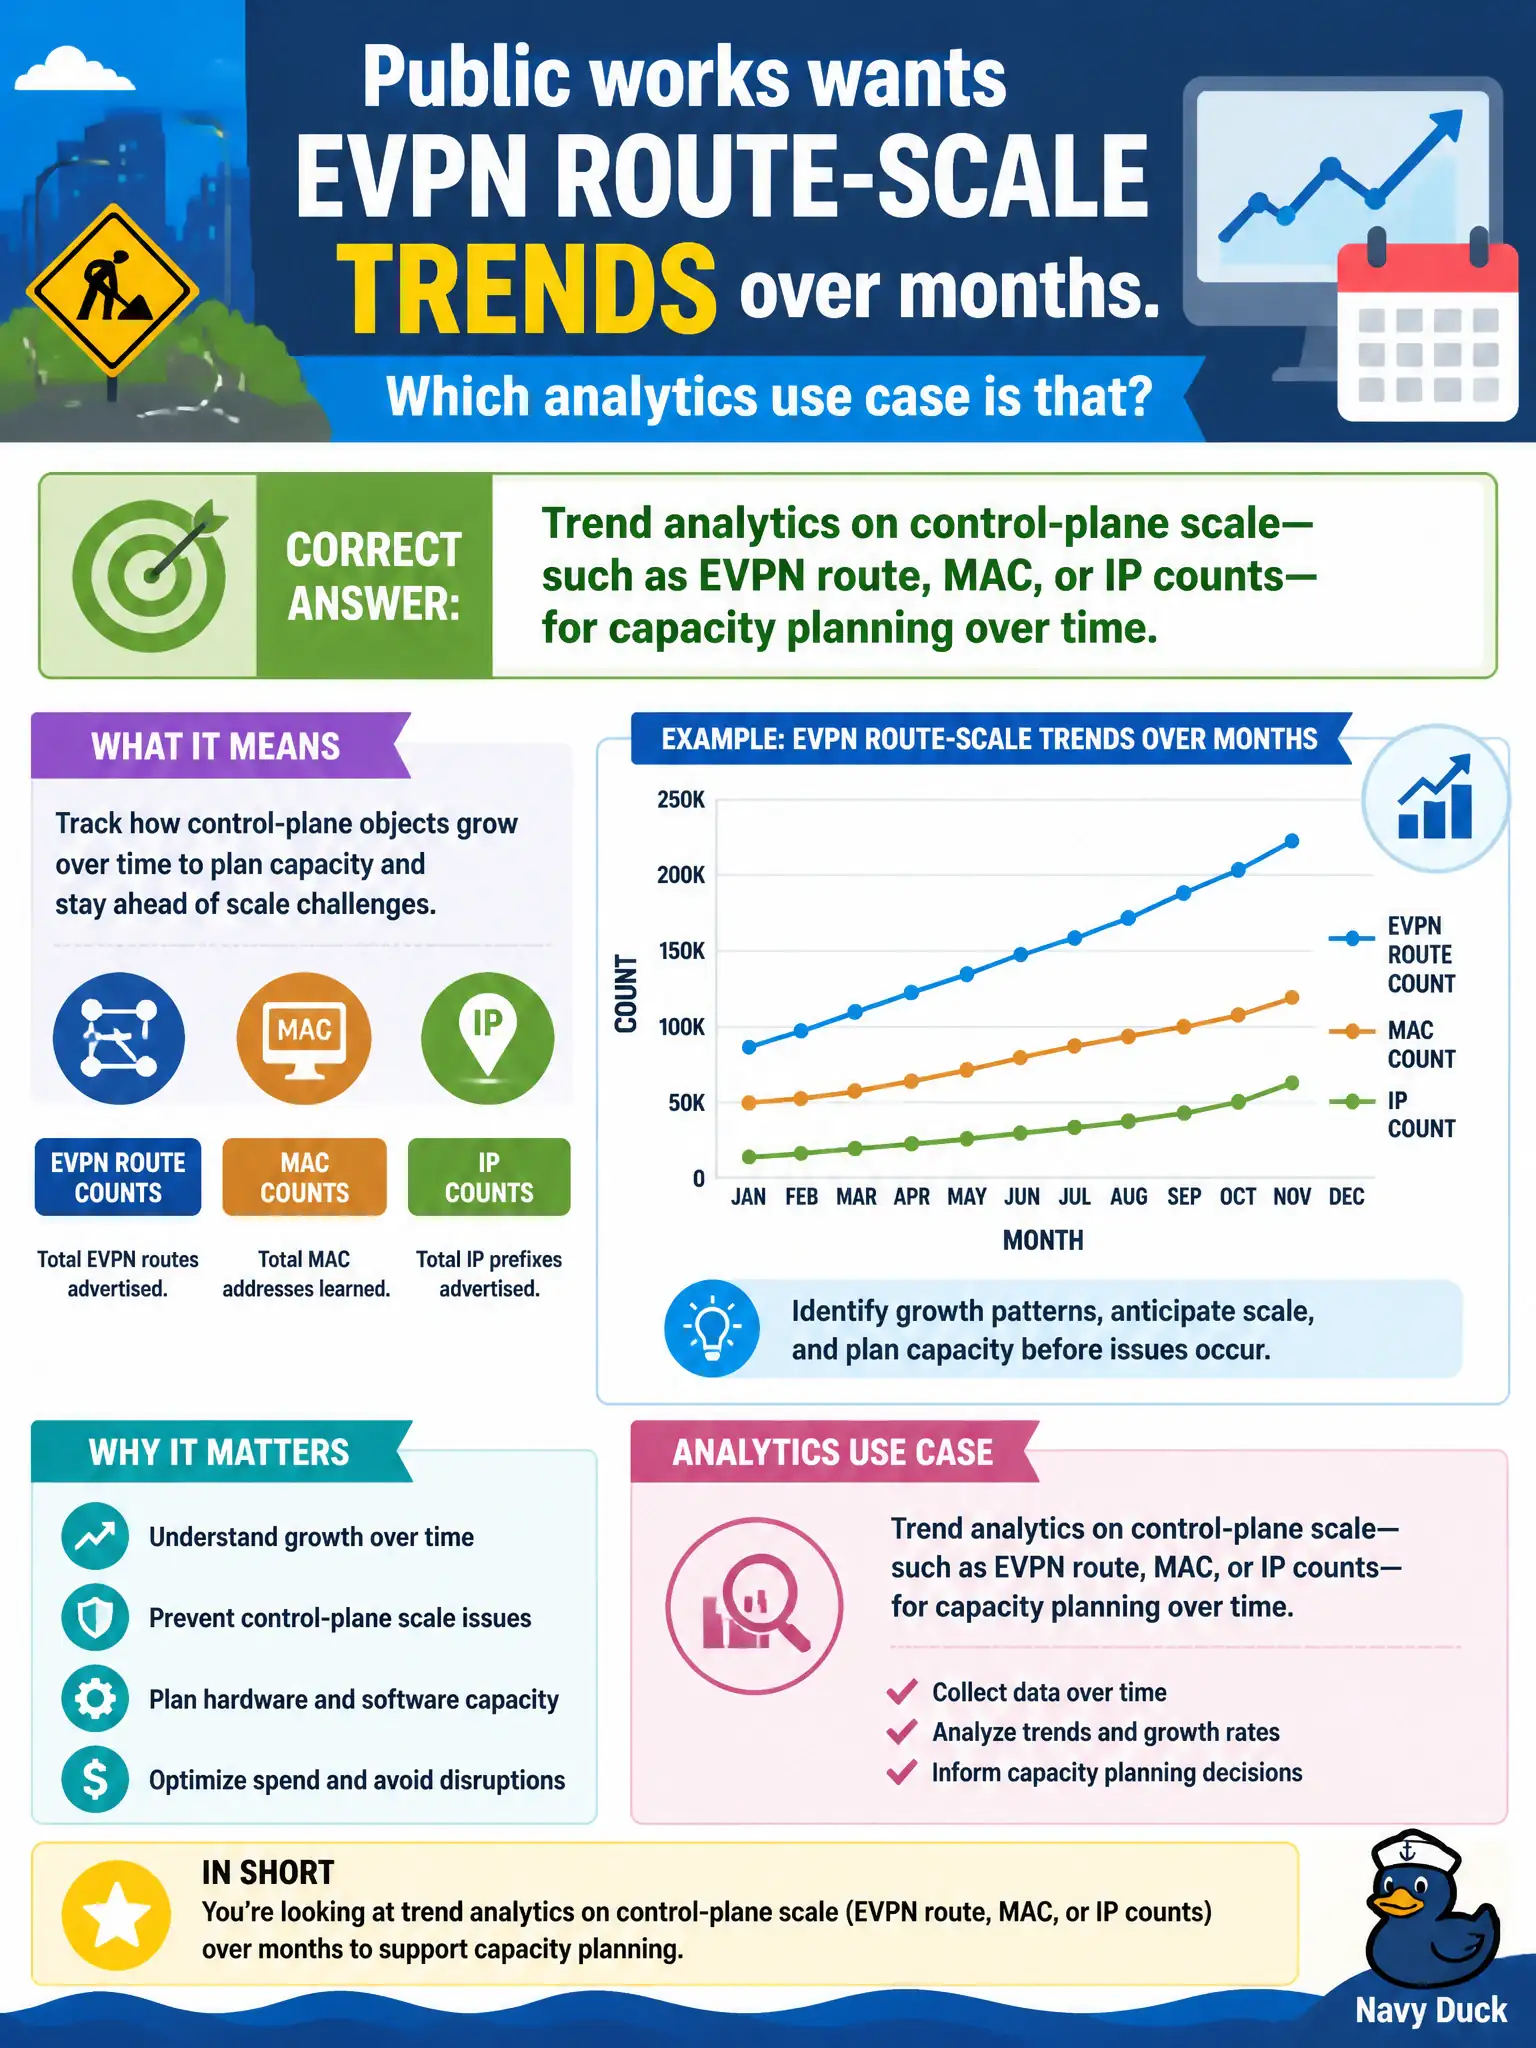
Watching EVPN route counts climb month after month is capacity planning with a line chart—are we approaching the cliff? Trends need history, not a one-off show or a room thermostat. Public works wants the growth curve, not a single Polaroid.
Full Explanation
Wanting EVPN route-scale trends over months is trend analytics on control-plane scale—EVPN route, MAC, or IP counts—for capacity planning across public-works growth. Live packet captures alone do not provide multi-month aggregation. Vacant meeting-room temperature is unrelated. One-time CLI snapshots never stored cannot form trends. Exam caveat: Retain time-series of table sizes; ad-hoc show commands are snapshots, not capacity curves. Operational check: Graph EVPN route/MAC counts for 30+ days and set a capacity warning before hardware limits. In civic data-center operations, record the expected CLI or collector evidence for this concept so the next on-call engineer can validate fabric behavior without re-deriving the design under incident pressure. In civic data-center operations, record the expected CLI or collector evidence for this concept so the next on-call engineer can validate fabric behavior without re-deriving the design under incident pressure. In civic data-center operations, record the expected CLI or collector evidence for this concept so the next on-call engineer can validate fabric behavior without re-deriving the design under incident pressure. In civic data-center operations, record the expected CLI or collector evidence for this concept so the next on-call engineer can validate fabric behavior without re-deriving the design under incident pressure.