
After an outage, operations discovers that several hypervisor hosts had rising fan speeds, high temperatures and disk errors for days beforehand, but nobody noticed. What should be implemented?
Select an answer to reveal the explanation.
Short Explanation
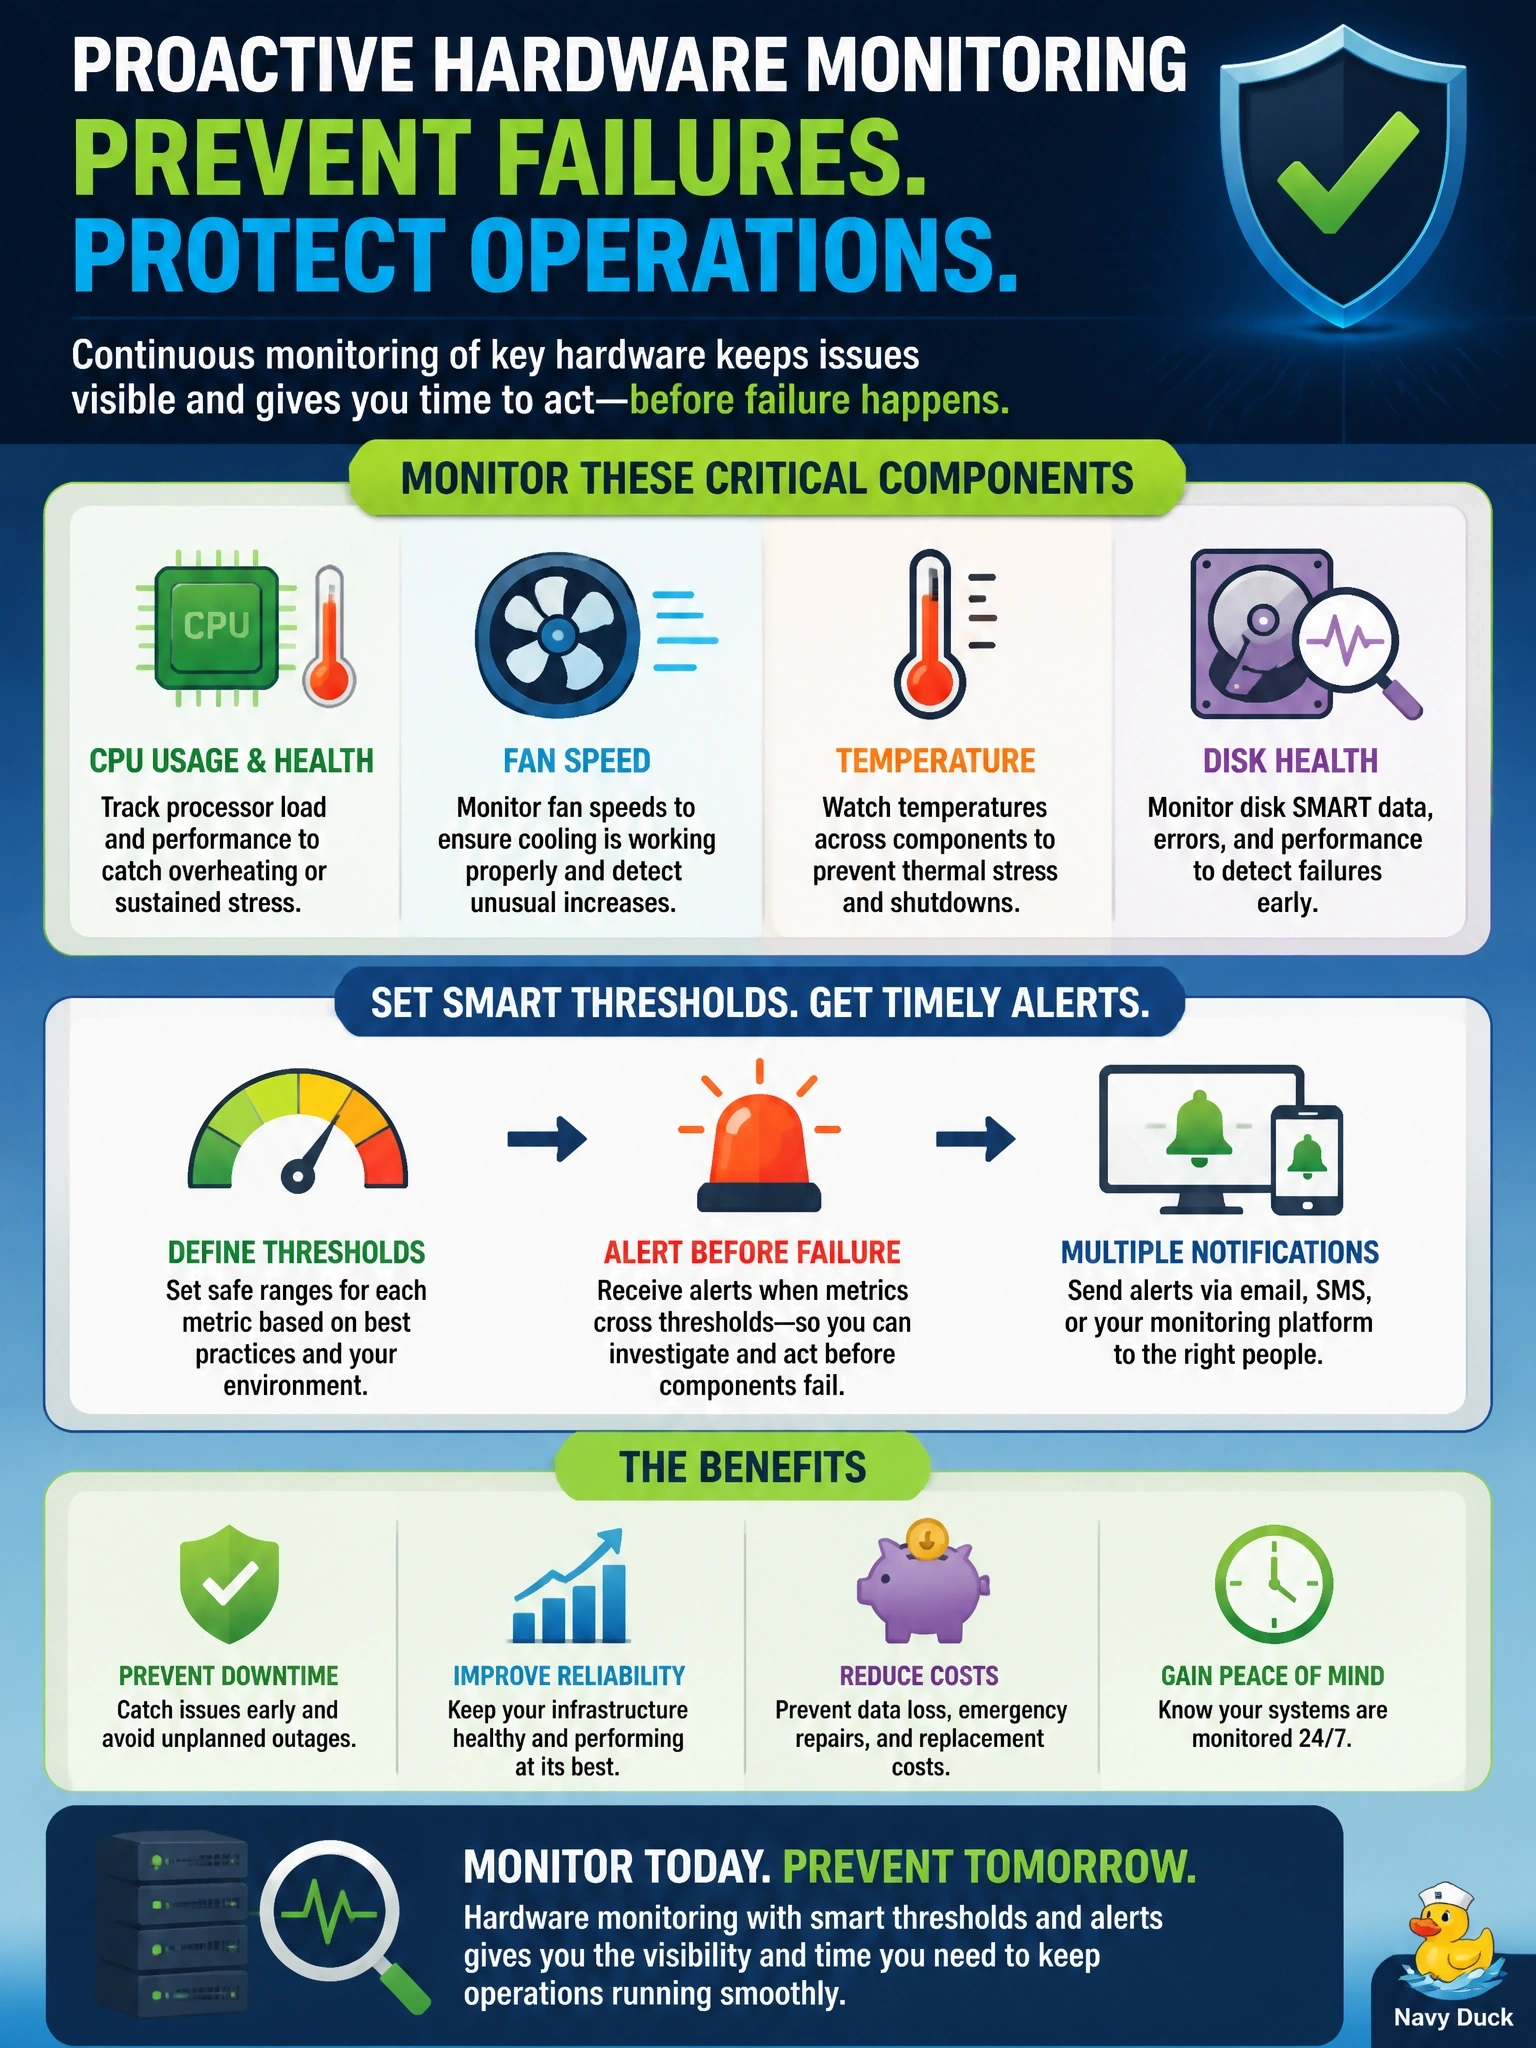
Your hosts were basically shouting for help for days, and nobody was listening. Hardware monitoring with thresholds turns those early warnings into alerts you can act on before the outage. The trap is a tool that only explains the failure after it's already happened.
Full Explanation
Hardware monitoring collects health telemetry from physical hosts, typically through baseboard management controllers and platform sensors: disk SMART status and error counts, CPU temperature and load, fan speeds, power supply state and chassis temperature. Defined thresholds, both static and based on trends, raise alerts to the operations team or trigger automated actions such as placing a host into maintenance mode, so failing components can be replaced before they cause an outage. This is the preventive control the scenario lacks. A quarterly physical inspection is far too infrequent to catch failures that develop over days, and indicator lights provide much less information than sensor telemetry. Application performance monitoring measures the user-visible effects of problems; it would show symptoms once performance degrades but does not observe fan, temperature or disk health directly. Longer log retention helps investigators after an incident, but retention without alerting does not prompt anyone to act while warning signs are present. Exam caveat: in public IaaS, PaaS and SaaS the provider monitors physical hardware; this objective applies to the provider's operations and to private clouds the organization runs itself. Operational check: confirm that every host's management controller sends sensor data to the monitoring platform, that alert thresholds exist for disk, CPU, fan and temperature, and that a simulated threshold breach creates a ticket for the on-call team.