
A derivatives-informed equity PM observes that a stock's 30-day implied volatility (IV) is trading at a 40% premium to its 90-day realized volatility (RV) in the weeks preceding an earnings announcement. An AI system flags this divergence as a potential signal. Which interpretation of this IV/RV spread is MOST consistent with options market microstructure theory, and what is the appropriate equity-level trade expression?
Select an answer to reveal the explanation.
Short Explanation and Infographic
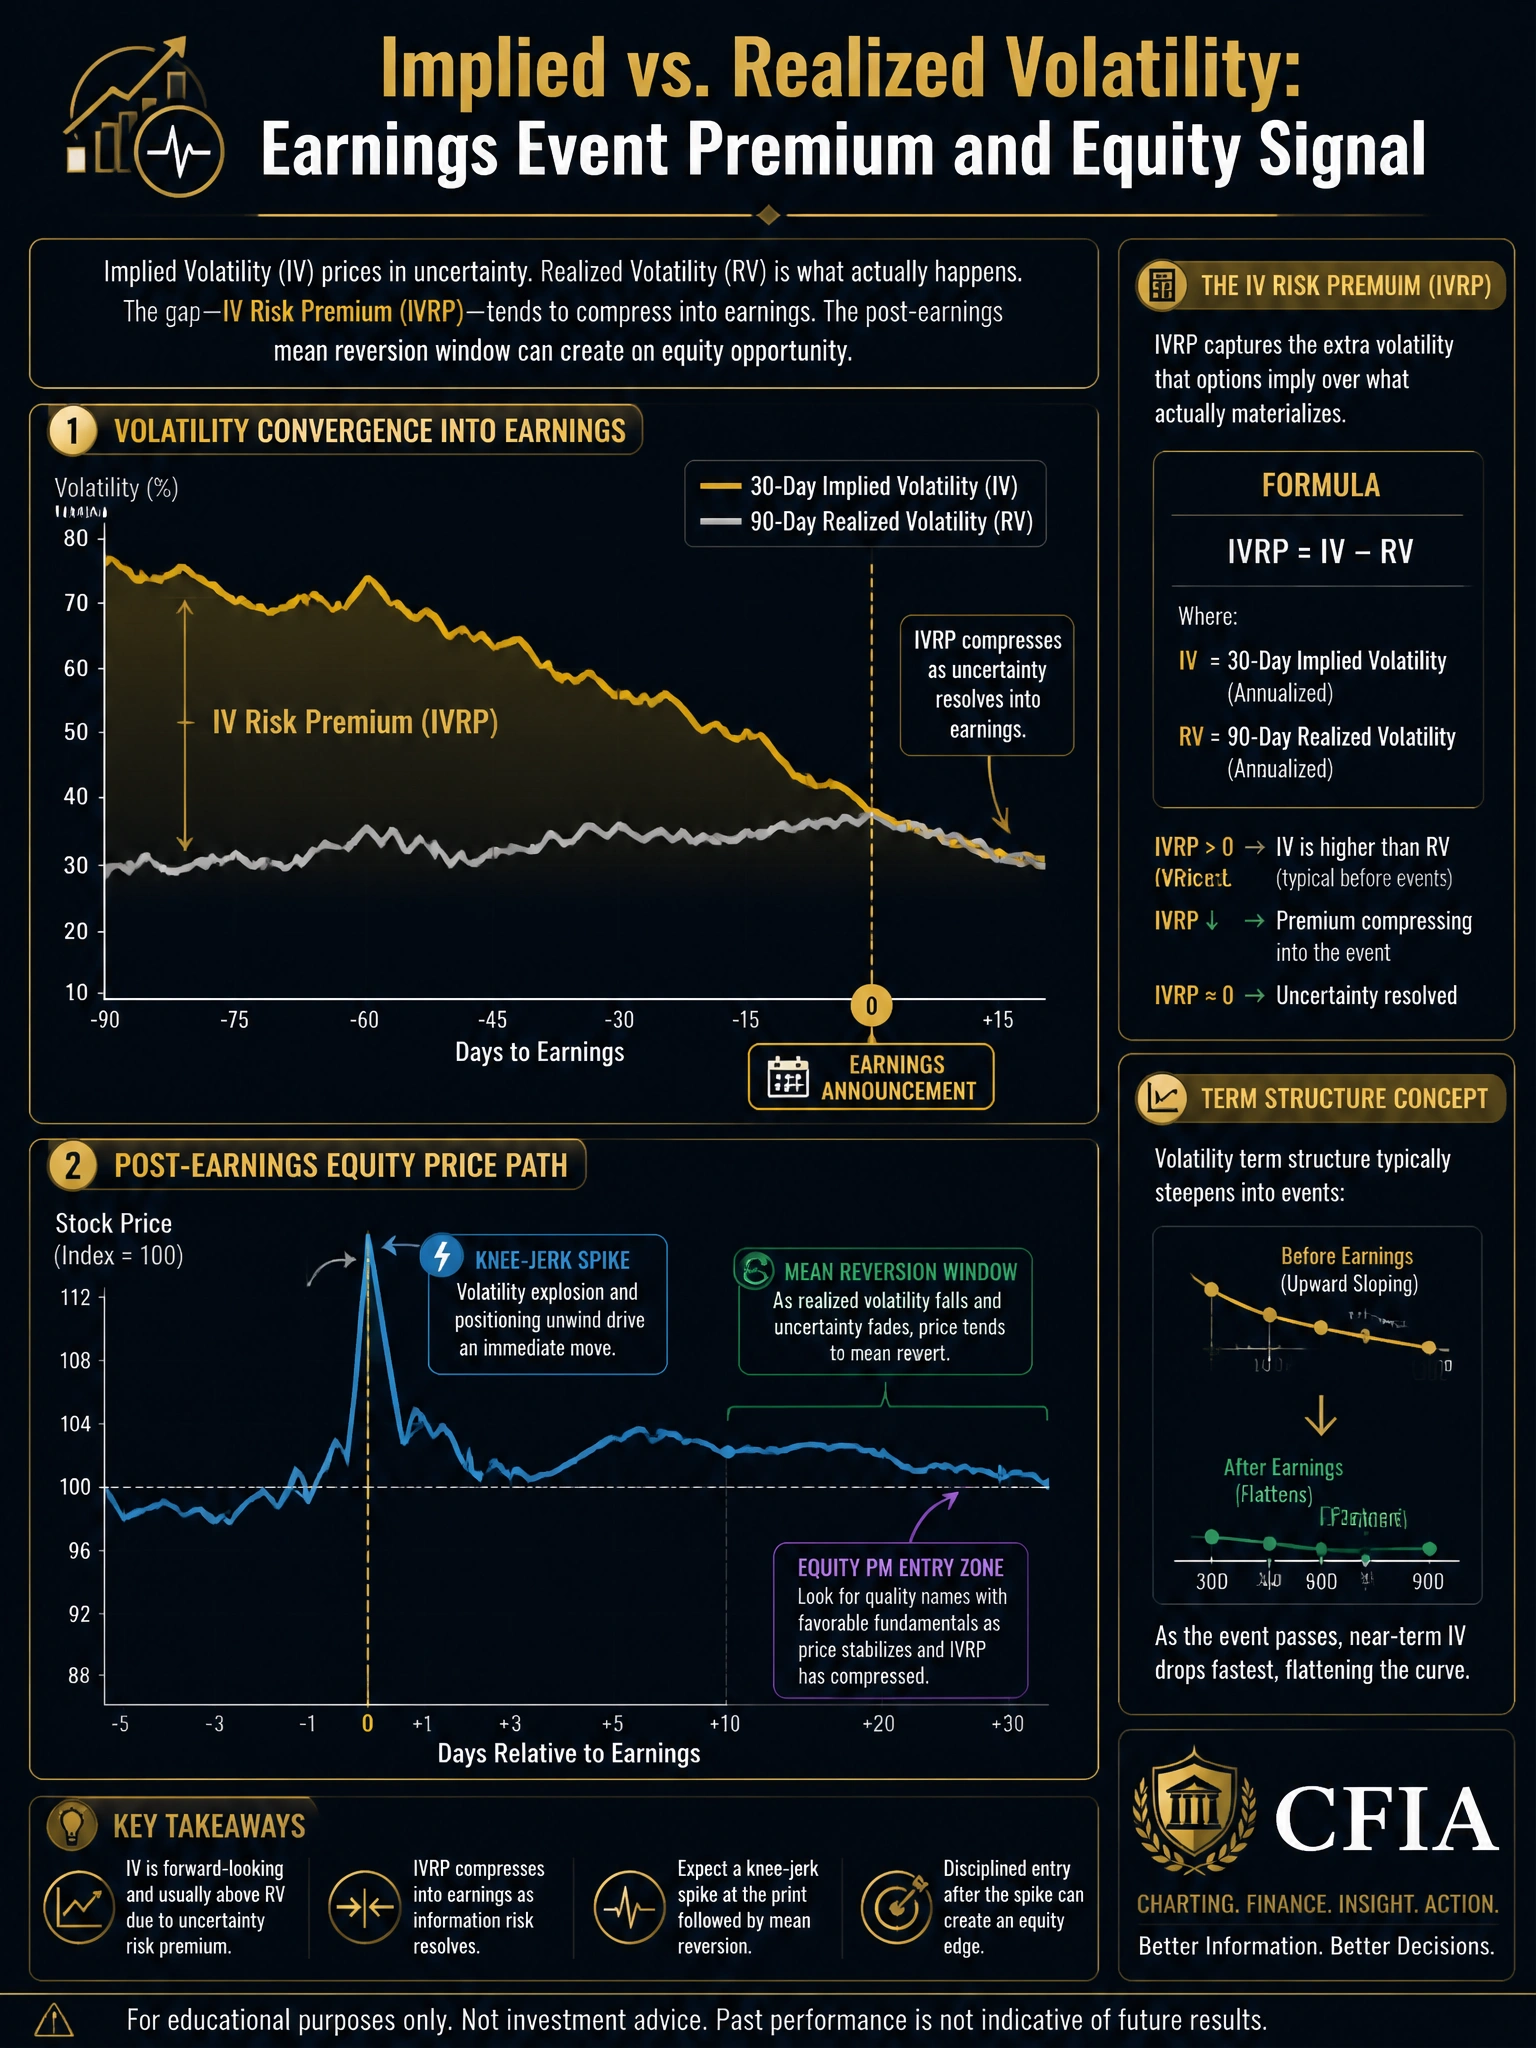
The options market is like a crowd at a carnival guessing the weight of a pig — when the crowd gets very excited about an upcoming announcement, they often overpay for insurance. When the event passes and the pig turns out to be fairly ordinary, those who sold the overpriced insurance collect their premium. For equity PMs, that means the stock often settles more quietly than the pre-announcement frenzy suggests.
Full explanation below image
Full Explanation
Option B is correct because the IV/RV spread captures the implied volatility risk premium (IVRP) — the systematic tendency for option-implied volatility to exceed subsequent realized volatility, particularly around earnings announcements. This premium compensates option sellers for bearing event uncertainty and jump risk. Academic work by Carr and Wu (2009) and Bollerslev, Gibson, and Zhou (2011) documents this premium as a persistent, systematic feature of equity option markets.
For an equity-level PM who does not trade options directly, the IVRP carries informational content about consensus expectations. When IV is significantly elevated versus RV, the market is pricing in a large move. If the announcement resolves without an extreme outcome, the stock tends to exhibit mean-reverting behavior — the initial knee-jerk reaction often overshoots fair value in both directions before settling. A disciplined equity PM can exploit this by waiting for the post-announcement volatility to spike and then entering a position in the direction consistent with fundamental analysis, with a shorter holding period that captures the reversion to fair value.
Additionally, the term structure of implied volatility — specifically the 30-day vs. 90-day IV comparison — provides information about where the market is concentrating its uncertainty. A sharp kink in the term structure at the near-term expiration dates is a calendar-pinning signal that event-driven positioning is dominant in short-dated options.
Option A incorrectly conflates directional options positioning with IV levels. High IV can be driven by both put and call buying — elevated IV without skew analysis provides no directional inference about institutional positioning. Option C makes the same logical error in the bearish direction. Option D is incorrect; decades of empirical evidence and the entire volatility arbitrage industry contradict the claim that IV/RV divergences carry no predictive content.