
An asset manager has deployed an AI-assisted research workflow where analysts use AI tools to generate first drafts of company research notes, screen alternative data signals, and flag earnings surprises. The head of research wants to measure whether the AI-human team is outperforming the previous human-only process. Which measurement approach is most rigorous?
Select an answer to reveal the explanation.
Short Explanation and Infographic
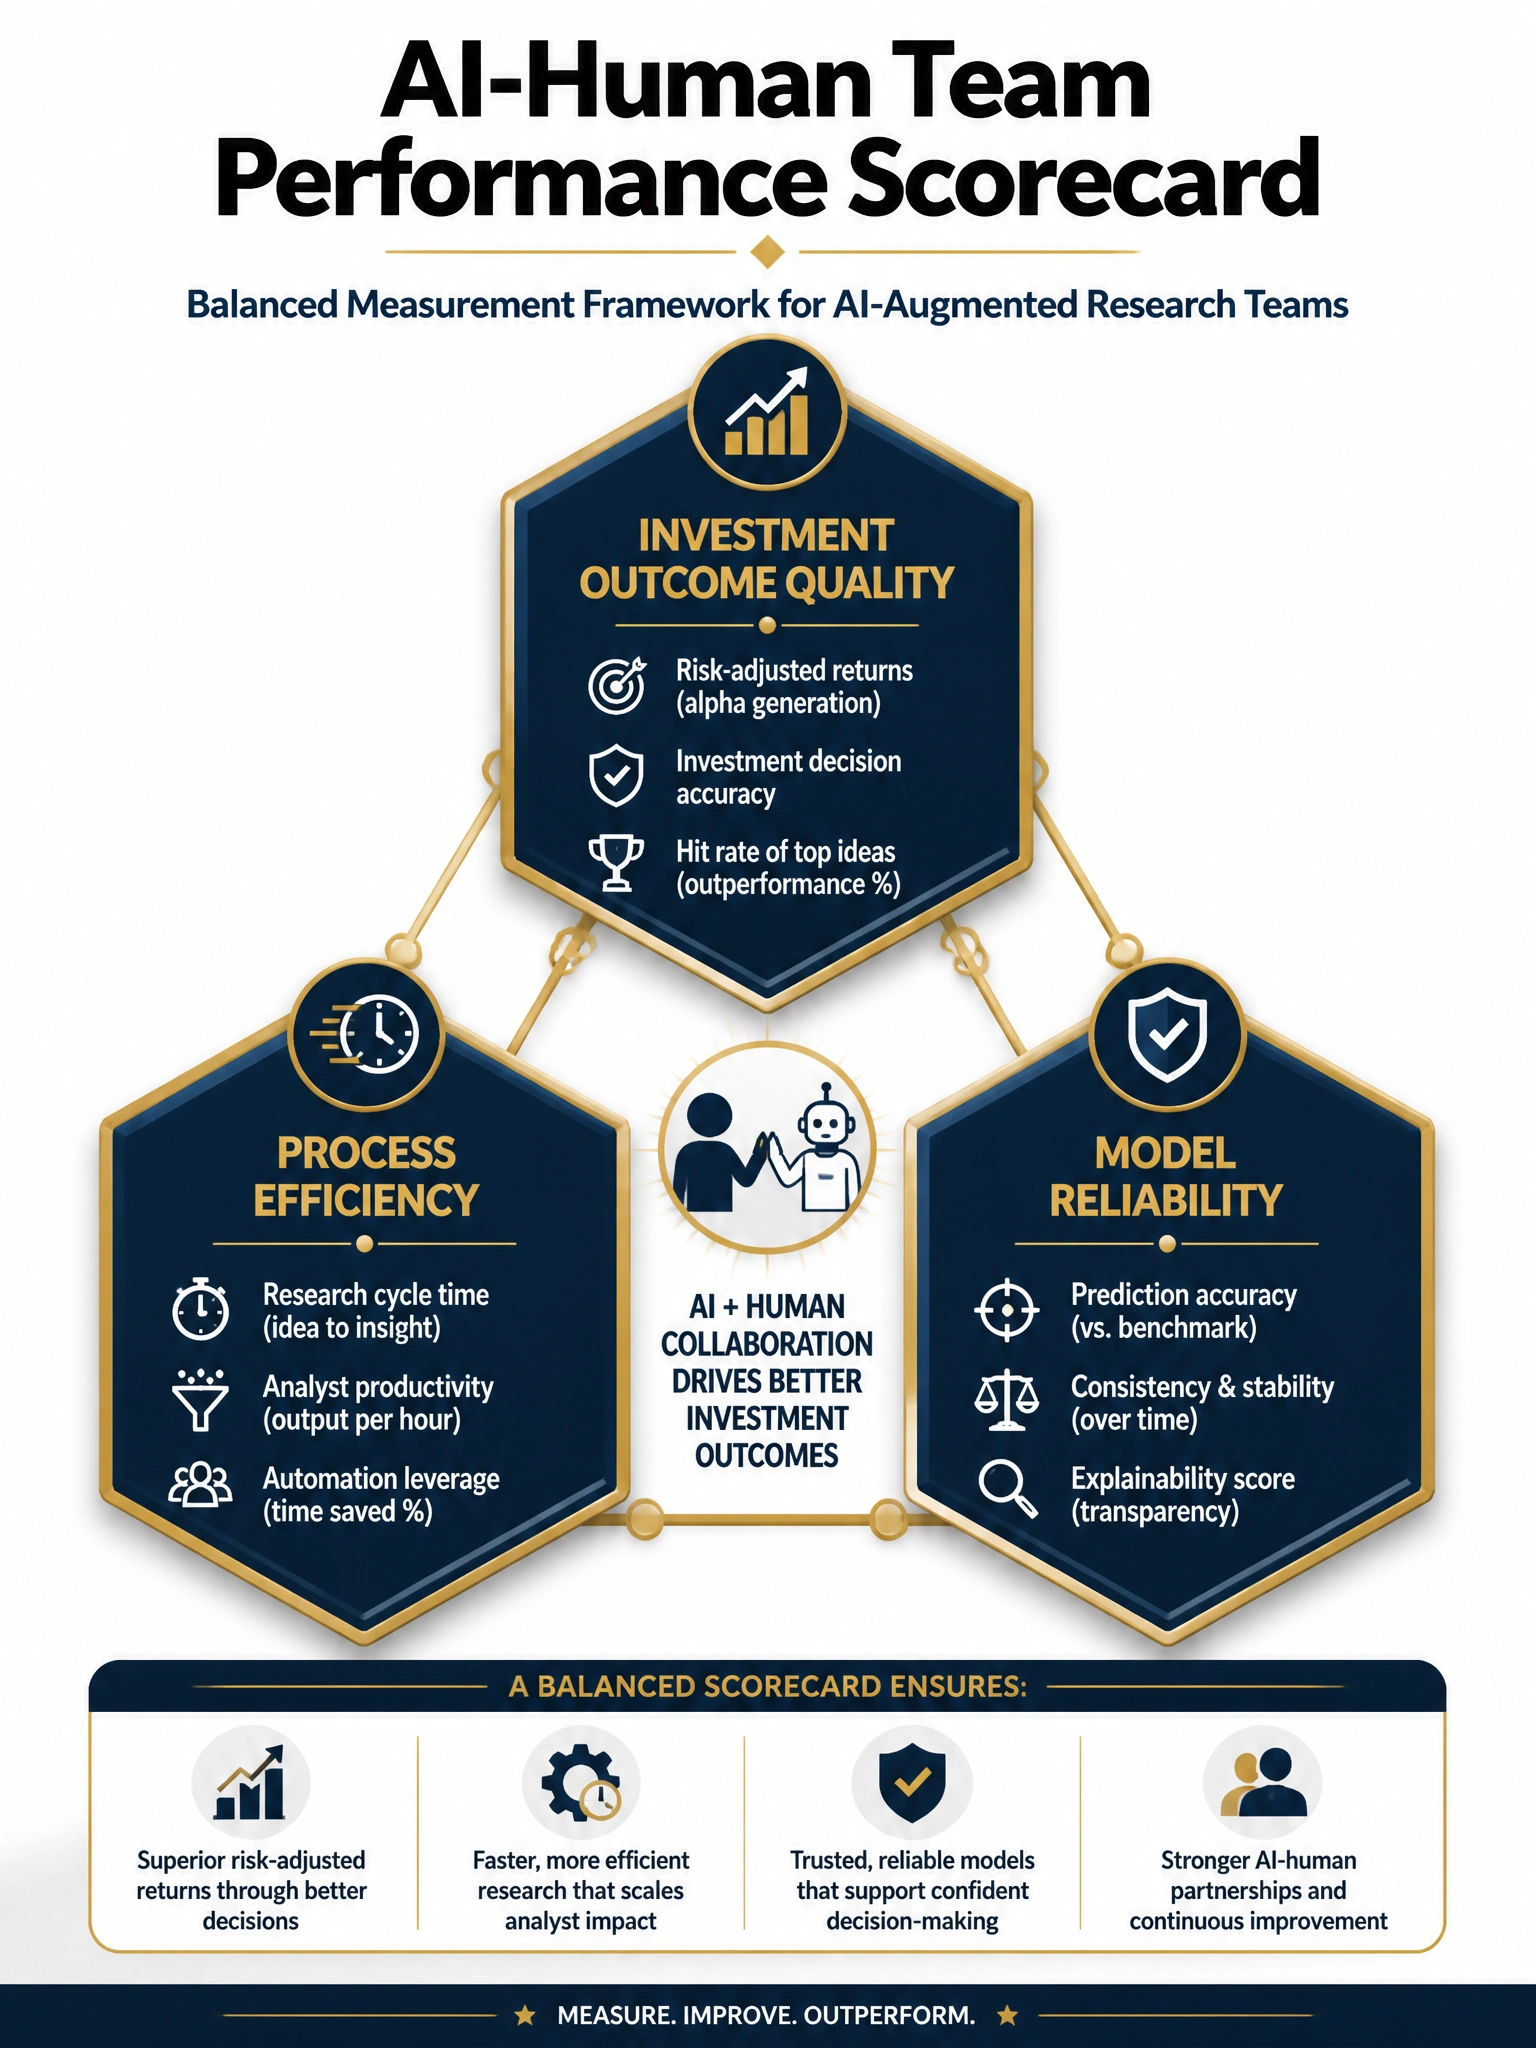
You can't judge a chef only by whether the restaurant is busy. The balanced scorecard approach measures three things at once: did the ideas make money, did the team cover more ground faster, and did the AI's signals actually prove out? That's the only way to know if the AI is genuinely helping.
Full explanation below image
Full Explanation
Measuring AI-human team performance in an investment research context requires isolating the contribution of AI-assisted processes from other performance determinants — market conditions, sector tilts, macro events, and portfolio construction decisions that sit outside research quality. A balanced scorecard approach provides the multi-dimensional visibility needed to separate process improvement from outcome luck.
The investment outcome quality dimension focuses on idea-level attribution: what was the average excess return of securities that analysts recommended within a defined holding period, and has this improved since AI tool deployment? This requires a structured idea-tracking database with entry dates, recommendations, and exit-basis returns — something many firms lack and must build alongside their AI tools. The process efficiency dimension captures volume metrics: how many companies are analysts covering per quarter, how quickly are notes published relative to earnings events, and has the time from earnings call to published research dropped? These metrics are observable and can be tracked immediately. The model reliability dimension closes the loop on the AI itself: when the AI's signal screener flagged a stock as an earnings surprise candidate, what percentage of flags were validated by subsequent earnings outcomes? A signal with 55% precision is actionable; one with 35% creates noise that degrades analyst judgment.
Option A (satisfaction surveys) measures comfort, not performance — analysts may be satisfied with tools that generate no investment value. Option B (note count) measures volume but ignores quality; publishing more low-quality notes is strictly worse than fewer high-quality ones. Option D (fund returns) is too aggregated and too lagged to isolate research process effects — quarterly returns reflect dozens of factors beyond analyst idea quality. The CFA Institute's investment process evaluation standards and the MFS Investment Management internal measurement model both support the multi-axis approach reflected in Option C.