
A systematic equity team is integrating a gradient boosting model (GBM) to enhance a traditional five-factor model (market, size, value, momentum, quality). The GBM is trained on 200 fundamental and technical features to predict 1-month forward returns. The team observes that training accuracy is 82% while out-of-sample accuracy drops to 58%. Which of the following BEST explains this outcome and prescribes the correct remediation?
Select an answer to reveal the explanation.
Short Explanation and Infographic
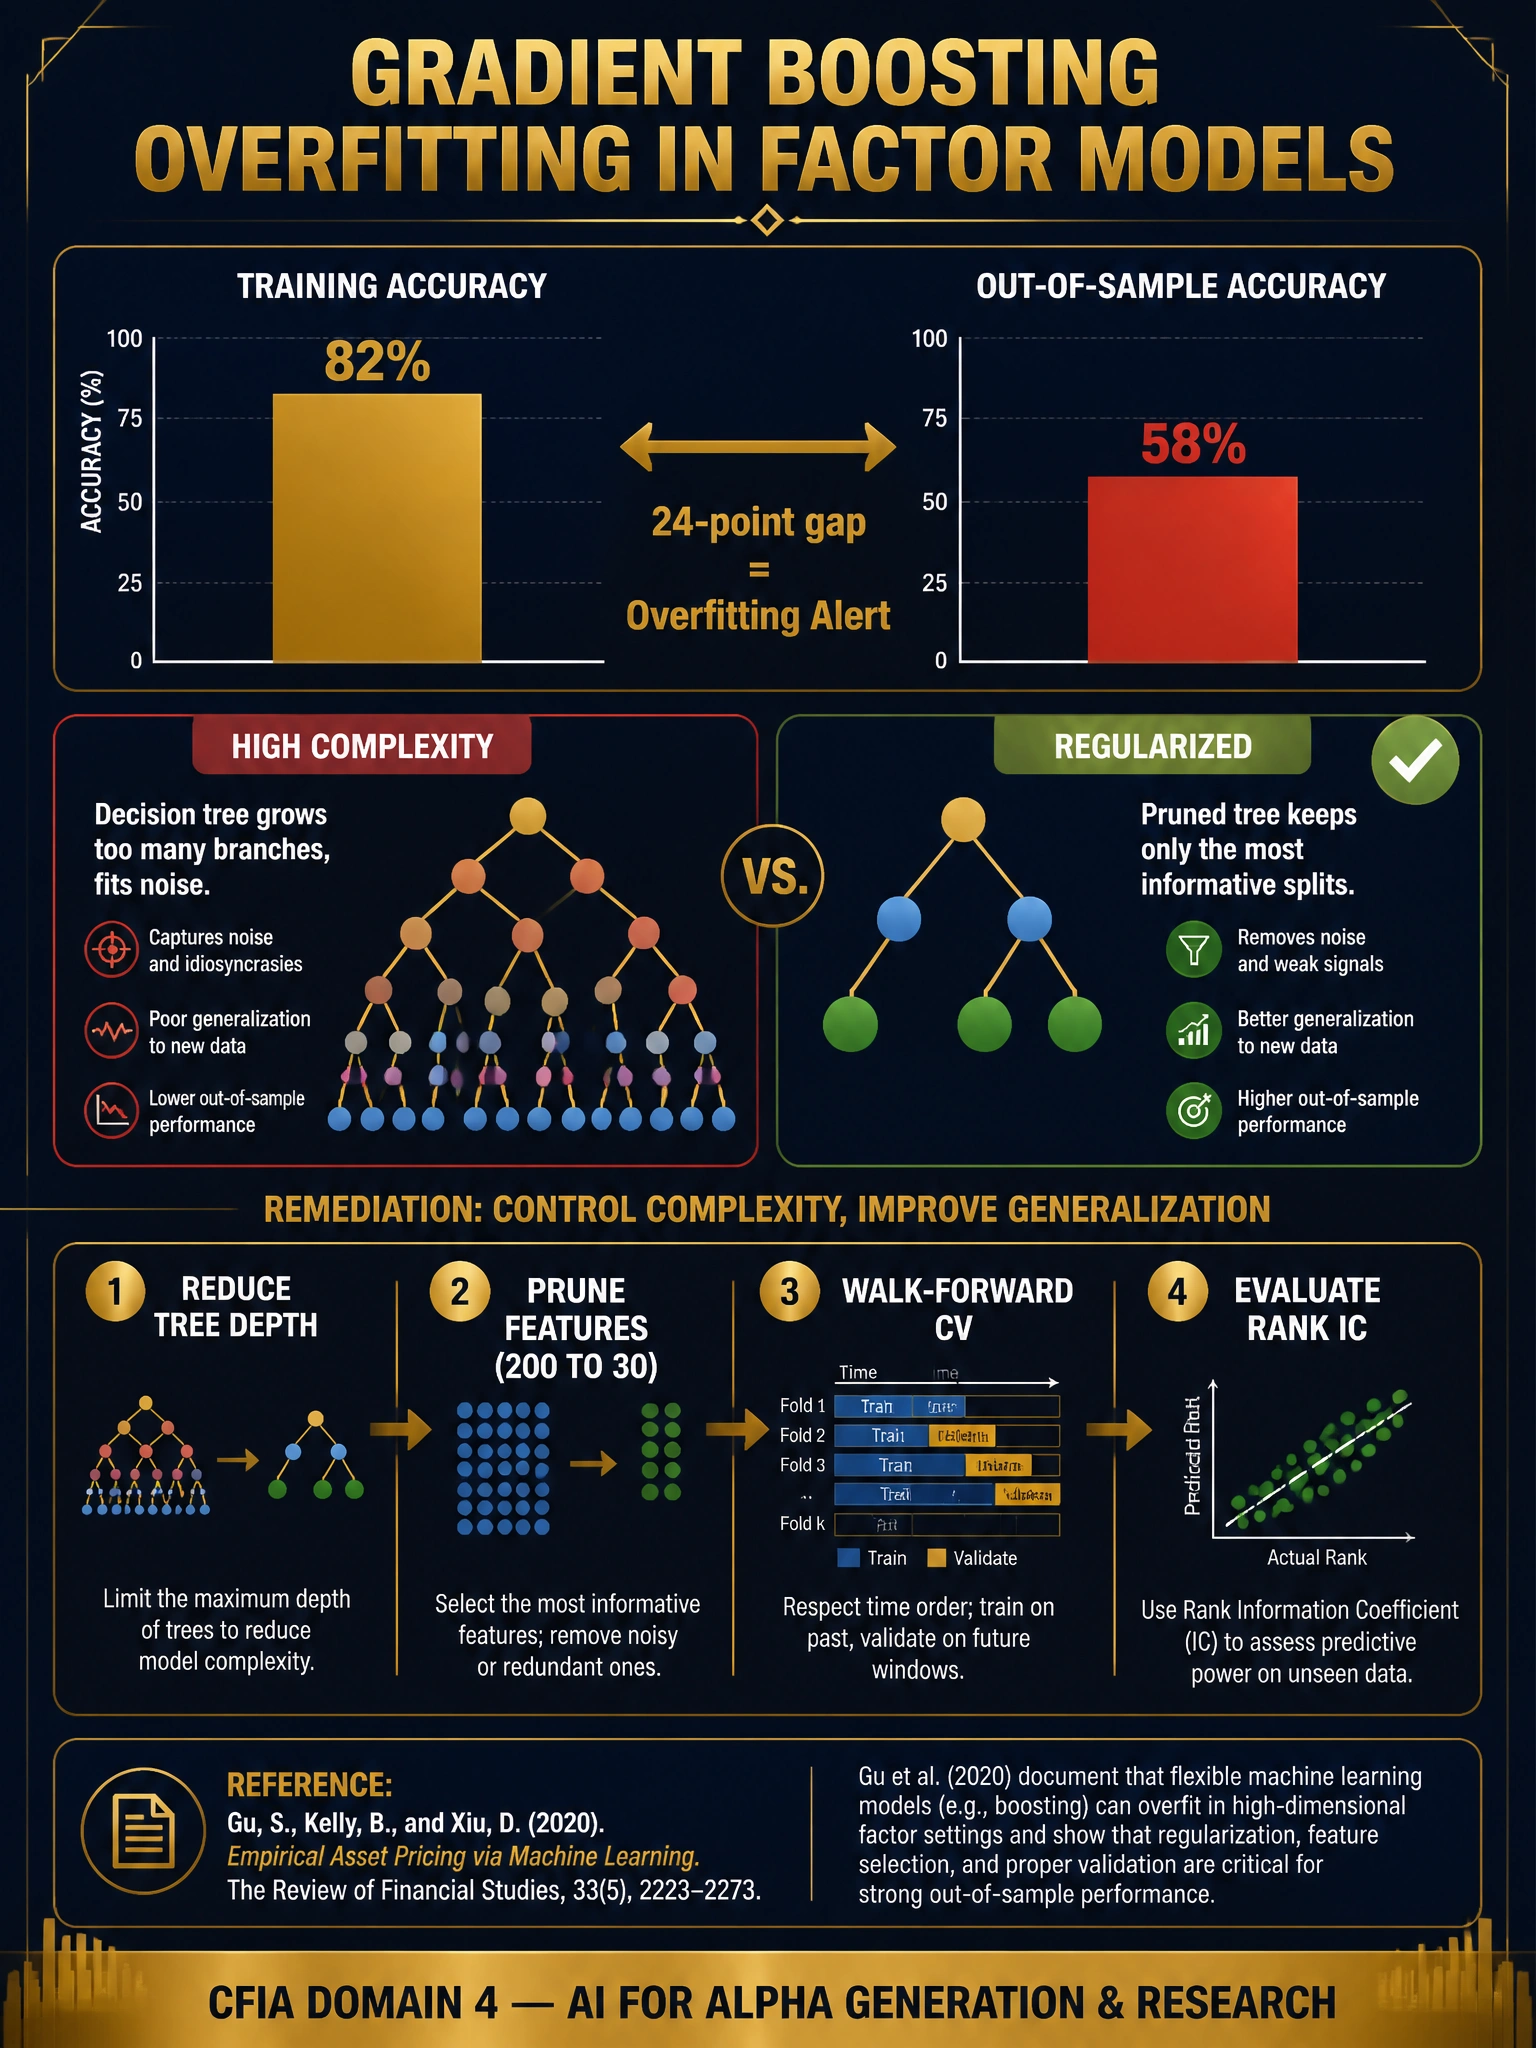
An 82%-in-sample vs. 58%-out-of-sample gap is your model basically memorizing the training data instead of learning generalizable patterns — that's textbook overfitting. Financial time series are notoriously data-scarce relative to the number of features you can throw at them, and gradient boosting is an eager memorizer if left unregulated. The fix is to simplify the model, prune correlated features, and enforce regularization — not to add more complexity.
Full explanation below image
Full Explanation
The 24-percentage-point accuracy gap between training and out-of-sample performance is the hallmark of overfitting, not underfitting. Gradient boosting models are high-variance learners that can memorize idiosyncratic noise in training data, particularly when the feature-to-sample ratio is high. In financial time series, an effective independent sample is far smaller than the raw data row count because returns are serially correlated; a five-year daily history of 500 stocks might appear to be 650,000 data points but contains far fewer truly independent observations.
Option A (underfitting / add more features) is wrong because the 82% training accuracy demonstrates the model has ample expressive capacity. Adding more features to an already overfitted model amplifies the problem.
Option C (58% is acceptable) is incorrect without context. While equity return prediction is inherently noisy, deploying a model with a known 24-point train-test gap without investigation is imprudent portfolio management. The gap itself is the red flag, independent of the absolute OOS number.
Option D (switch to deep neural networks) is counterproductive. Deep networks are higher-complexity models with even greater overfitting risk on tabular financial data at typical dataset sizes. The research literature (e.g., Grinold and Kahn, Gu et al. 2020 RFS) consistently shows regularized tree models outperform untuned neural networks on cross-sectional equity prediction with moderate feature sets.
Correct remediation includes: (1) reducing tree depth and the number of estimators, (2) applying L1 regularization or feature importance pruning to cut the 200 features to a parsimonious set of 20–40, (3) using walk-forward cross-validation appropriate for time series to properly estimate generalization, and (4) evaluating IC (information coefficient) and rank IC rather than raw accuracy.