
A developer notices that a GitHub Copilot agent that automates dependency updates is repeatedly failing partway through its task. The agent's final output is missing, but the task did not throw an exception. To identify where the failure is occurring, the developer opens the agent's trace. Which artifact in the trace will most directly reveal where the agent stopped making progress?
Select an answer to reveal the explanation.
Short Explanation
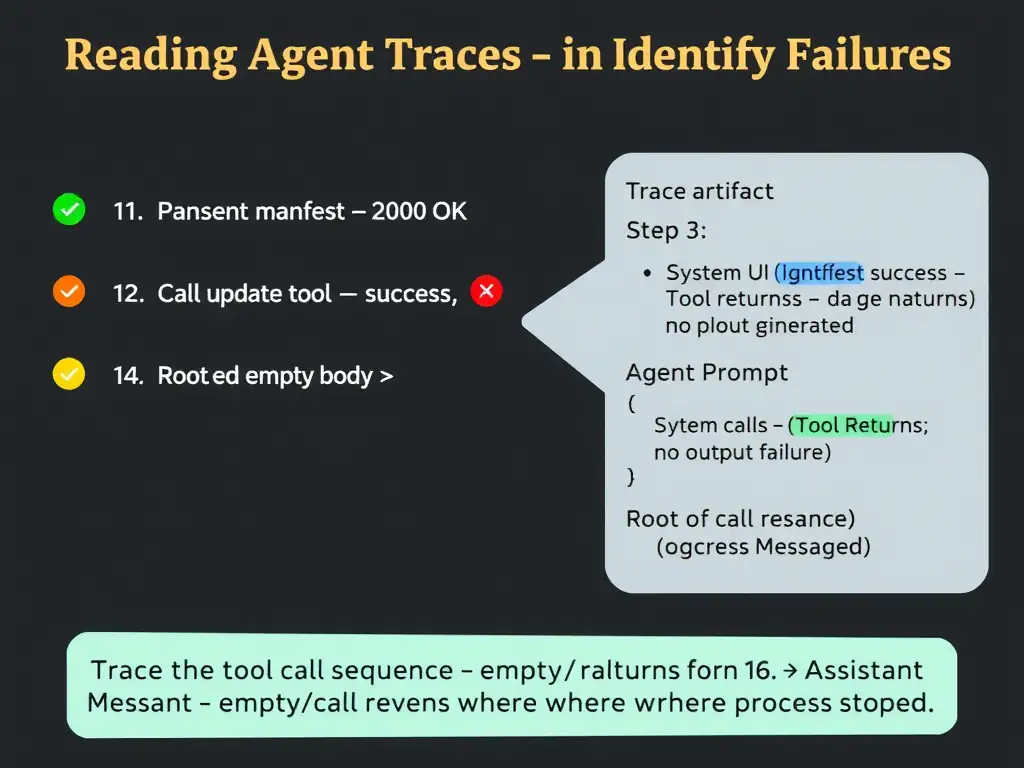
The trace is like a flight data recorder — it captures every action the agent took in order. When an agent stops making progress without throwing an exception, read the sequence of tool calls and their return values first. Look for the last call that returned an empty result, a timeout, or an unexpected response, and that's where the investigation starts.
Full Explanation
Agent traces record the full execution history of a run, including each reasoning step, tool invocation, and the tool's return value. When an agent fails silently, with no exception and no final output, the failure is almost always embedded in the middle of the trace as a tool call that returned an unexpected or empty result, causing the agent to loop, give up, or produce no output. The sequence of tool calls and their return values, including any empty or error responses mid-trace, is the primary diagnostic artifact for silent failures. By walking through the trace chronologically, you can find the exact step where the agent received a response it didn't handle correctly, such as a dependency manifest fetch that returned an empty body or a file write that returned a permission error the agent didn't surface as an exception. The system prompt stored in trace metadata is useful for understanding the agent's instructions but doesn't reveal runtime behavior; the prompt doesn't change during a run and won't show where the agent stopped. The total token count consumed by the agent run is an aggregate metric; it tells you how much the agent consumed but not what it did, and a high token count might suggest looping but doesn't pinpoint the failure step. The final assistant message at the end of the trace is exactly what's missing in this scenario, so looking there first is the wrong direction; the trace must be read from the beginning to find the point of failure.