
An engineering director wants to present agent ROI to the executive team. She has the following data after 90 days: story-point velocity increased 22%, review turnaround time dropped from 4.2 hours to 1.1 hours, defect escape rate decreased 15%, and agent infrastructure costs $8,000/month. Which metric combination MOST convincingly demonstrates ROI to a business audience?
Select an answer to reveal the explanation.
Short Explanation and Infographic
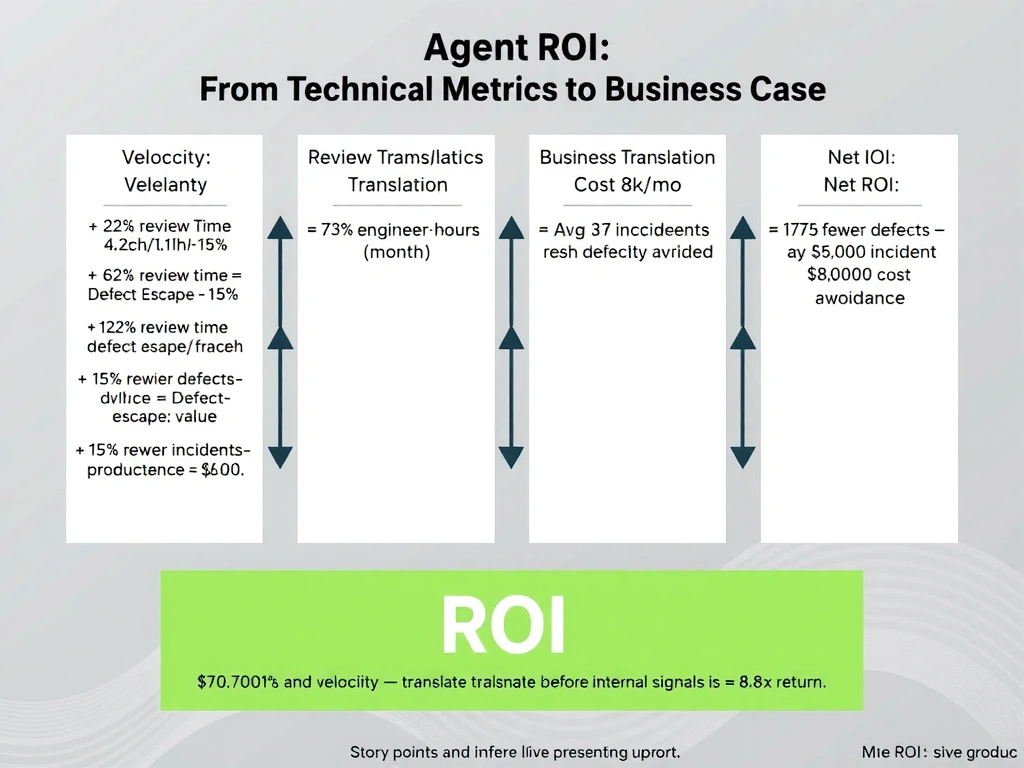
An executive doesn't know what a story point is — and shouldn't need to. The ROI argument that lands is one expressed in dollars and time: 'We freed up 120 engineer-hours per month previously spent waiting on reviews, and we're shipping 15% fewer bugs that used to cost us $X per incident to fix.' Translate technical metrics into business language and then anchor the cost against it.
Full explanation below image
Full Explanation
Executive ROI presentations require translating technical improvements into financial and strategic outcomes. Raw engineering metrics without business translation are unconvincing to non-technical leadership.
Option A (velocity + cost framed as cost per story point) fails because story points are an internal planning unit with no meaning to a business audience. Even framed as 'cost per story point,' the executive must then translate that back into business value — and most cannot do so reliably. Additionally, presenting cost without benefit context just highlights the expense.
Option B is correct. Review turnaround reduction from 4.2h to 1.1h is a 73% improvement — and this can be translated directly: if engineers were waiting 3.1h per PR and the team submits 200 PRs/month, that is 620 engineer-hours per month recovered (at, say, $85/hr burdened cost = $52,700/month in productivity). Defect escape reduction of 15% translates to fewer production incidents, lower mean time to repair costs, and reduced on-call burden — all directly expressible in dollars. These two numbers, expressed in business currency, dwarf the $8,000/month infrastructure cost and make the ROI case compellingly.
Option C (equal-weighted balanced scorecard) fails as an executive communication strategy. Presenting four metrics without prioritization creates cognitive load and dilutes the most powerful numbers. Executives need a clear headline.
Option D (infrastructure cost vs. industry benchmark) argues only that the cost is reasonable, not that it produces a return. This is the weakest possible ROI argument — it justifies cost but establishes no benefit.