
What GitHub feature enables administrators to view aggregate statistics on how GitHub Enterprise is being used across the organization?
Select an answer to reveal the explanation.
Short Explanation and Infographic
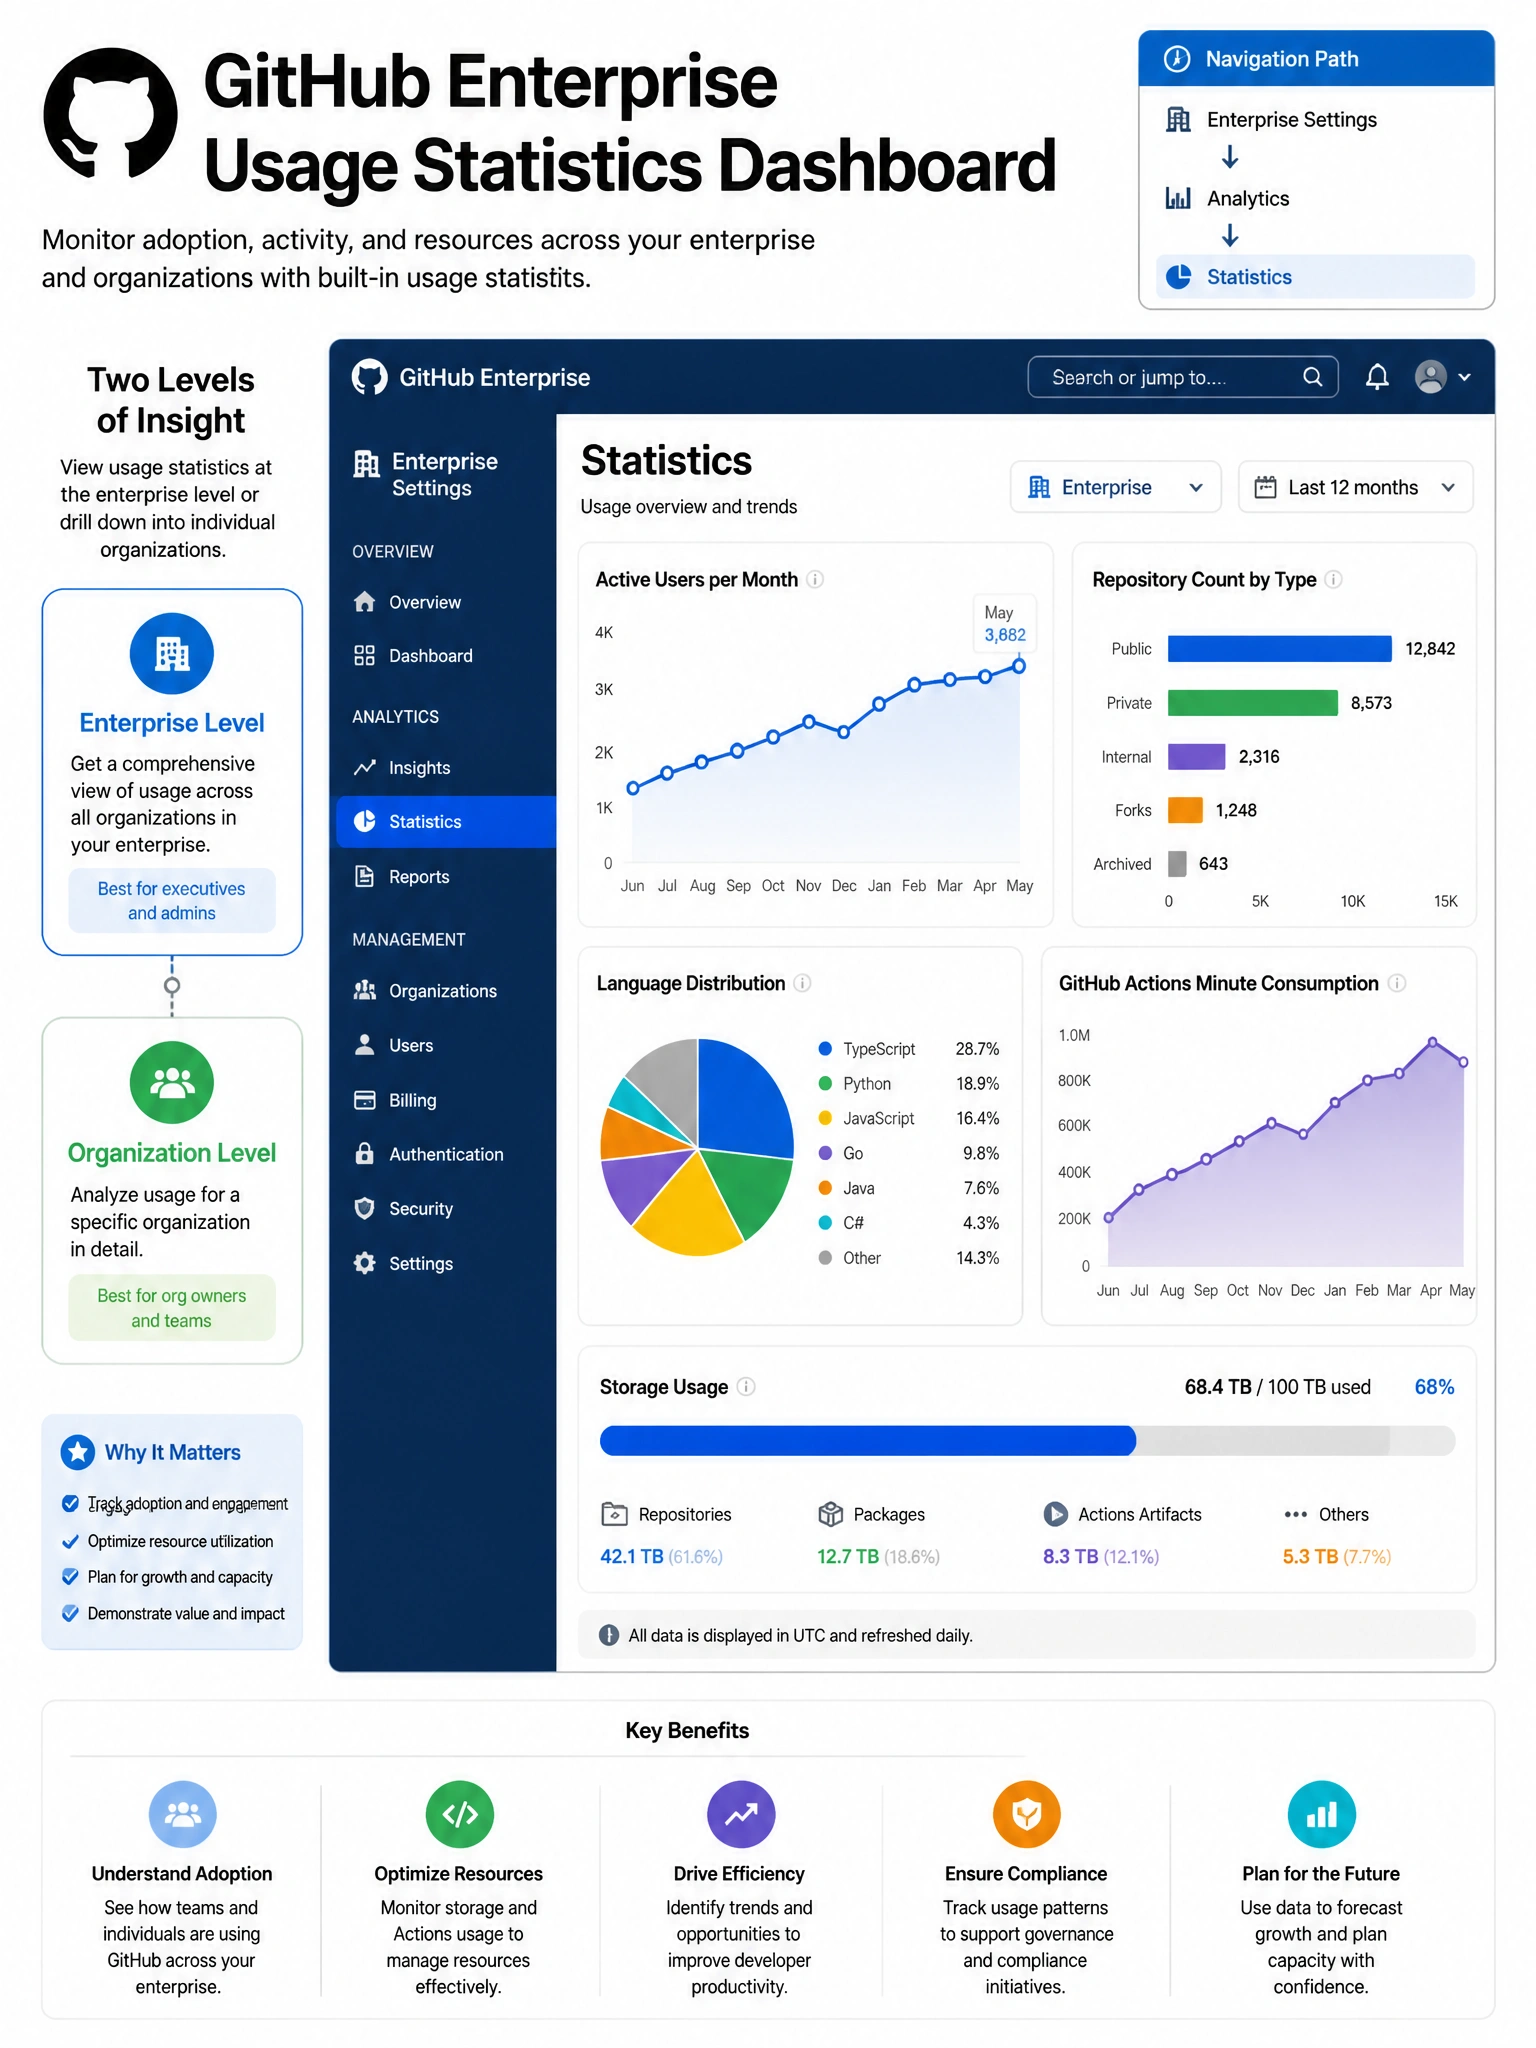
GitHub provides usage statistics dashboards that show admins the big picture — how many repos, how many active users, language distribution, popular repos. It's your bird's-eye view of how the enterprise is using GitHub.
Full explanation below image
Full Explanation
GitHub provides multiple administrative dashboards for usage visibility: (1) GitHub Enterprise Server Usage Statistics — site admins can view aggregate statistics including total repositories, user counts, language distribution, most-active repos, and system performance metrics from the site admin panel. (2) GitHub Organization Insights (available on Enterprise plans) — shows contribution activity, dependencies, and collaboration patterns across organizations. (3) GitHub Enterprise Cloud analytics — provides seat usage, Actions minute consumption, and repository statistics. (4) Security Overview (for GHAS) — aggregates security findings across repositories. These are distinct from the audit log (which records specific events) — statistics dashboards show aggregate patterns and trends for planning and governance decisions.