
What should an executive AI program dashboard for city leadership typically include?
Select an answer to reveal the explanation.
Short Explanation
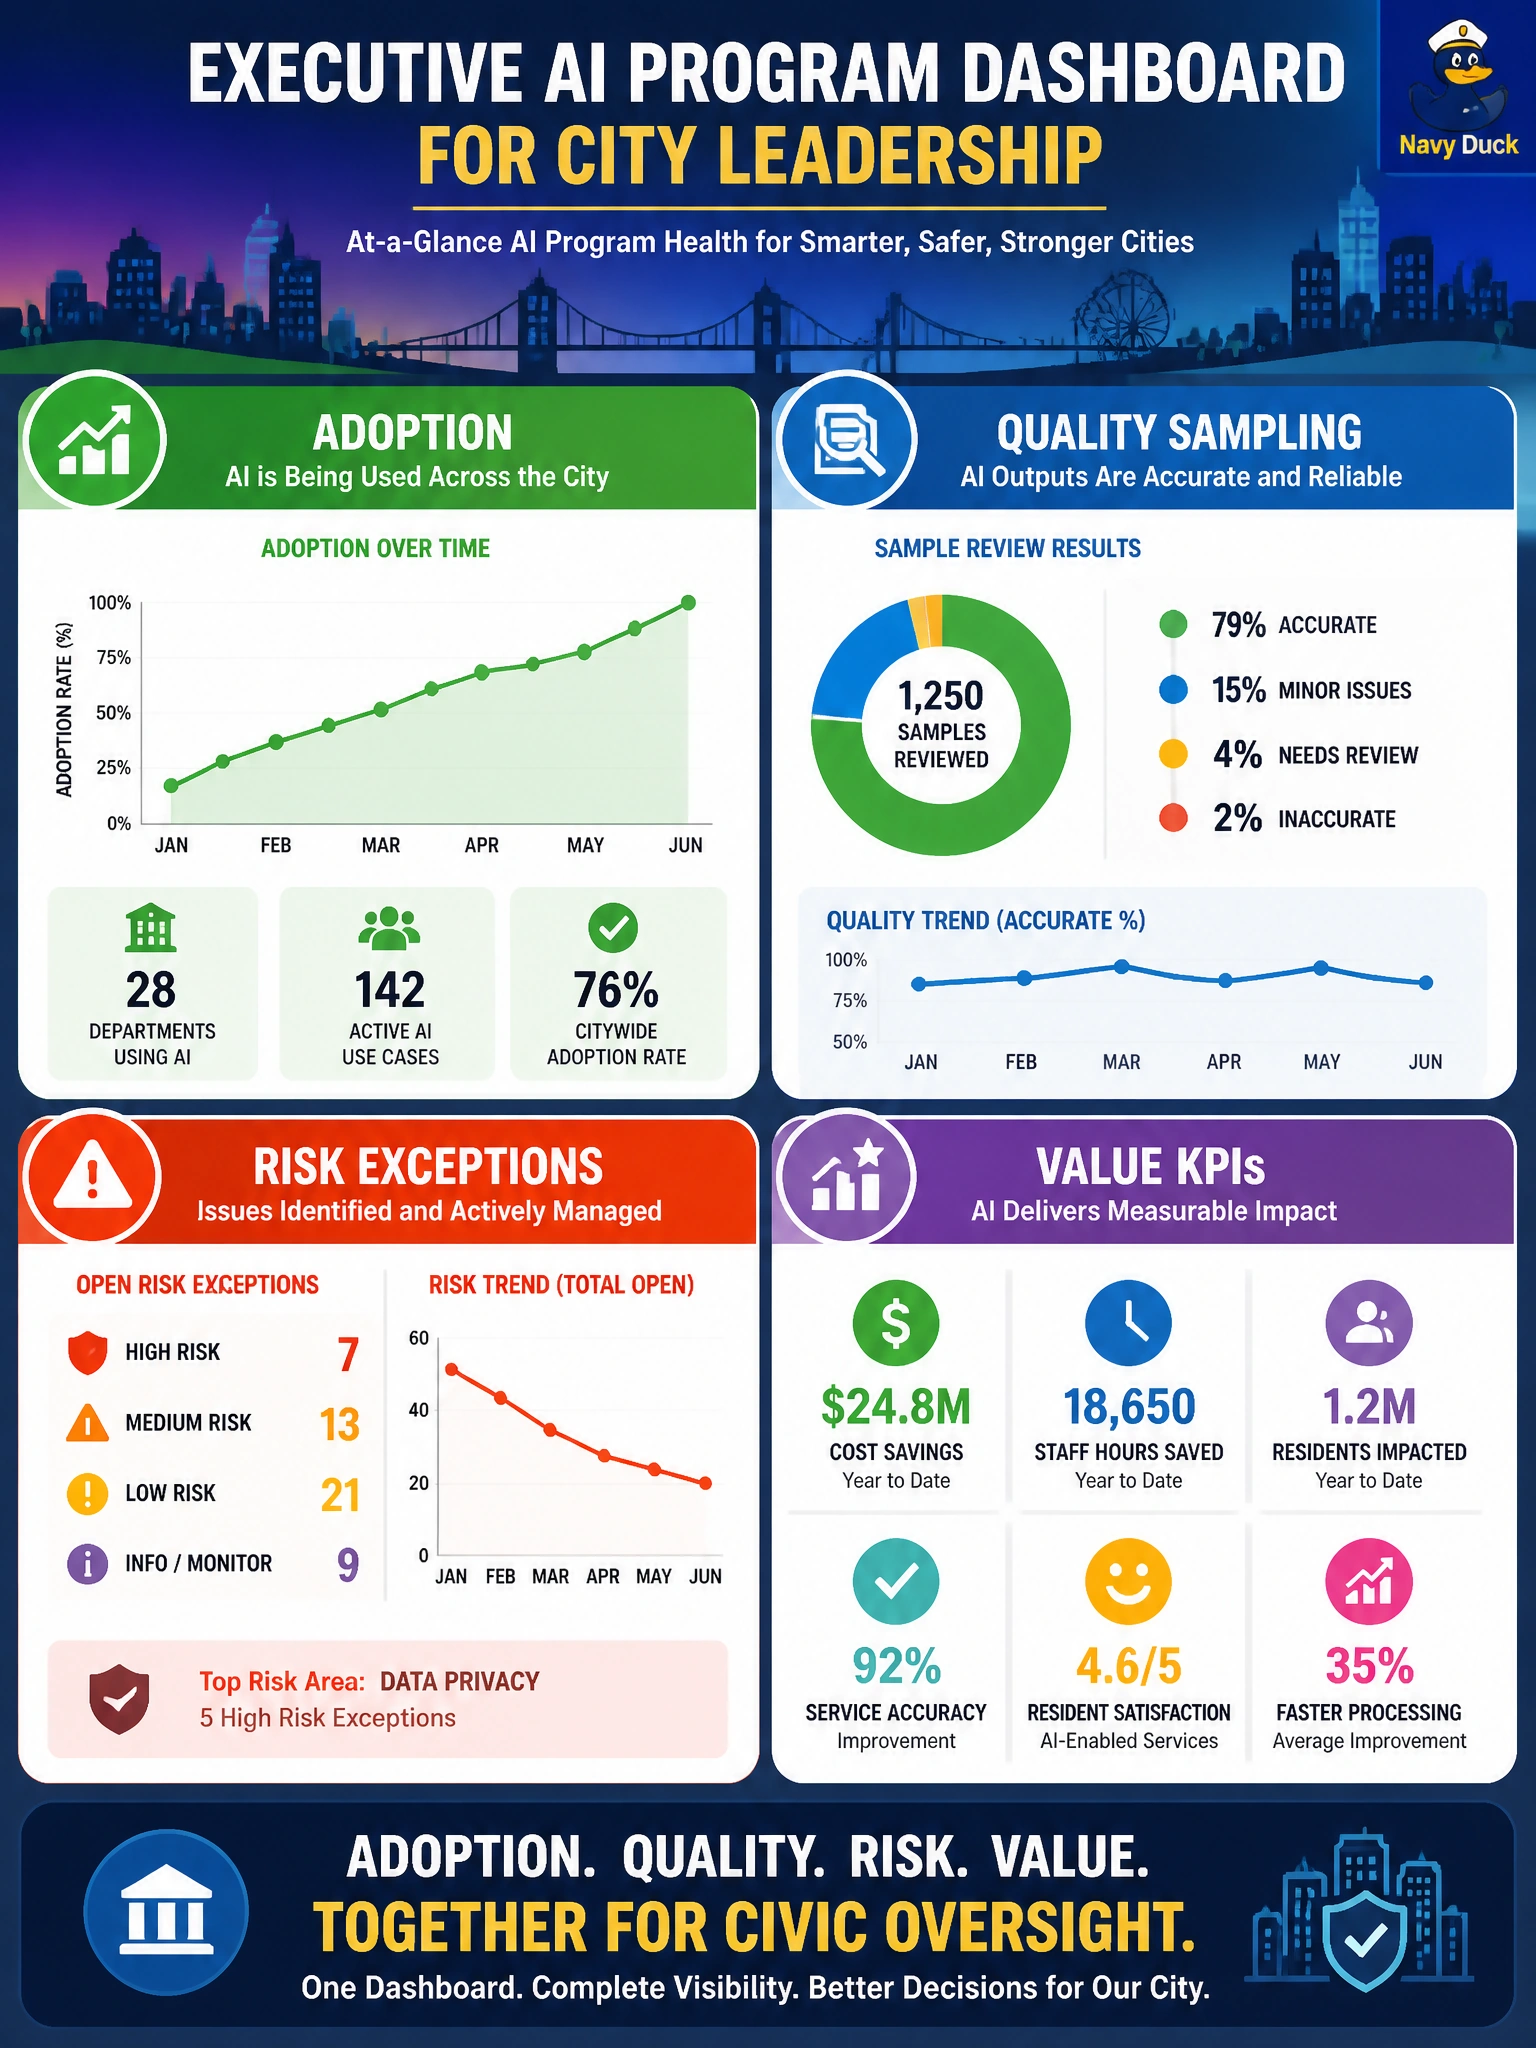
Executives need the whole cockpit—are people using it, is quality holding, what’s on fire, and is value showing up? One lonely login chart isn’t a dashboard; it’s a speedometer with no fuel gauge.
Full Explanation
Executive civic AI dashboards for city leadership should combine adoption, quality sampling, risk exceptions, and value KPIs so leaders can govern holistically across the municipal portfolio. That mix answers whether people use the tools, whether outputs are safe and correct, what is breaking policy or risk thresholds, and whether benefits materialize for the city and residents. Only raw model training loss curves without adoption or value context speak to engineering optimization, not program oversight by executives who must allocate scarce attention. Vendor promotional screenshots with no local operational metrics are marketing, not governance, and cannot show whether local controls work. A single vanity login count presented as complete program health omits quality, risk, and value and misleads keep-or-kill decisions when usage is high but answers are poor. Exam caveat: executive oversight needs a balanced scorecard for civic AI, not training curves or vendor collateral alone. Operational check: ship a leadership dashboard with adoption such as weekly active use, quality sample pass rates, open risk exceptions with aging, and value KPIs against baselines; review it in steering; escalate red quality or risk cells even when adoption looks strong; and keep training-loss views in engineering forums, not as the CIO’s sole pane of glass.