
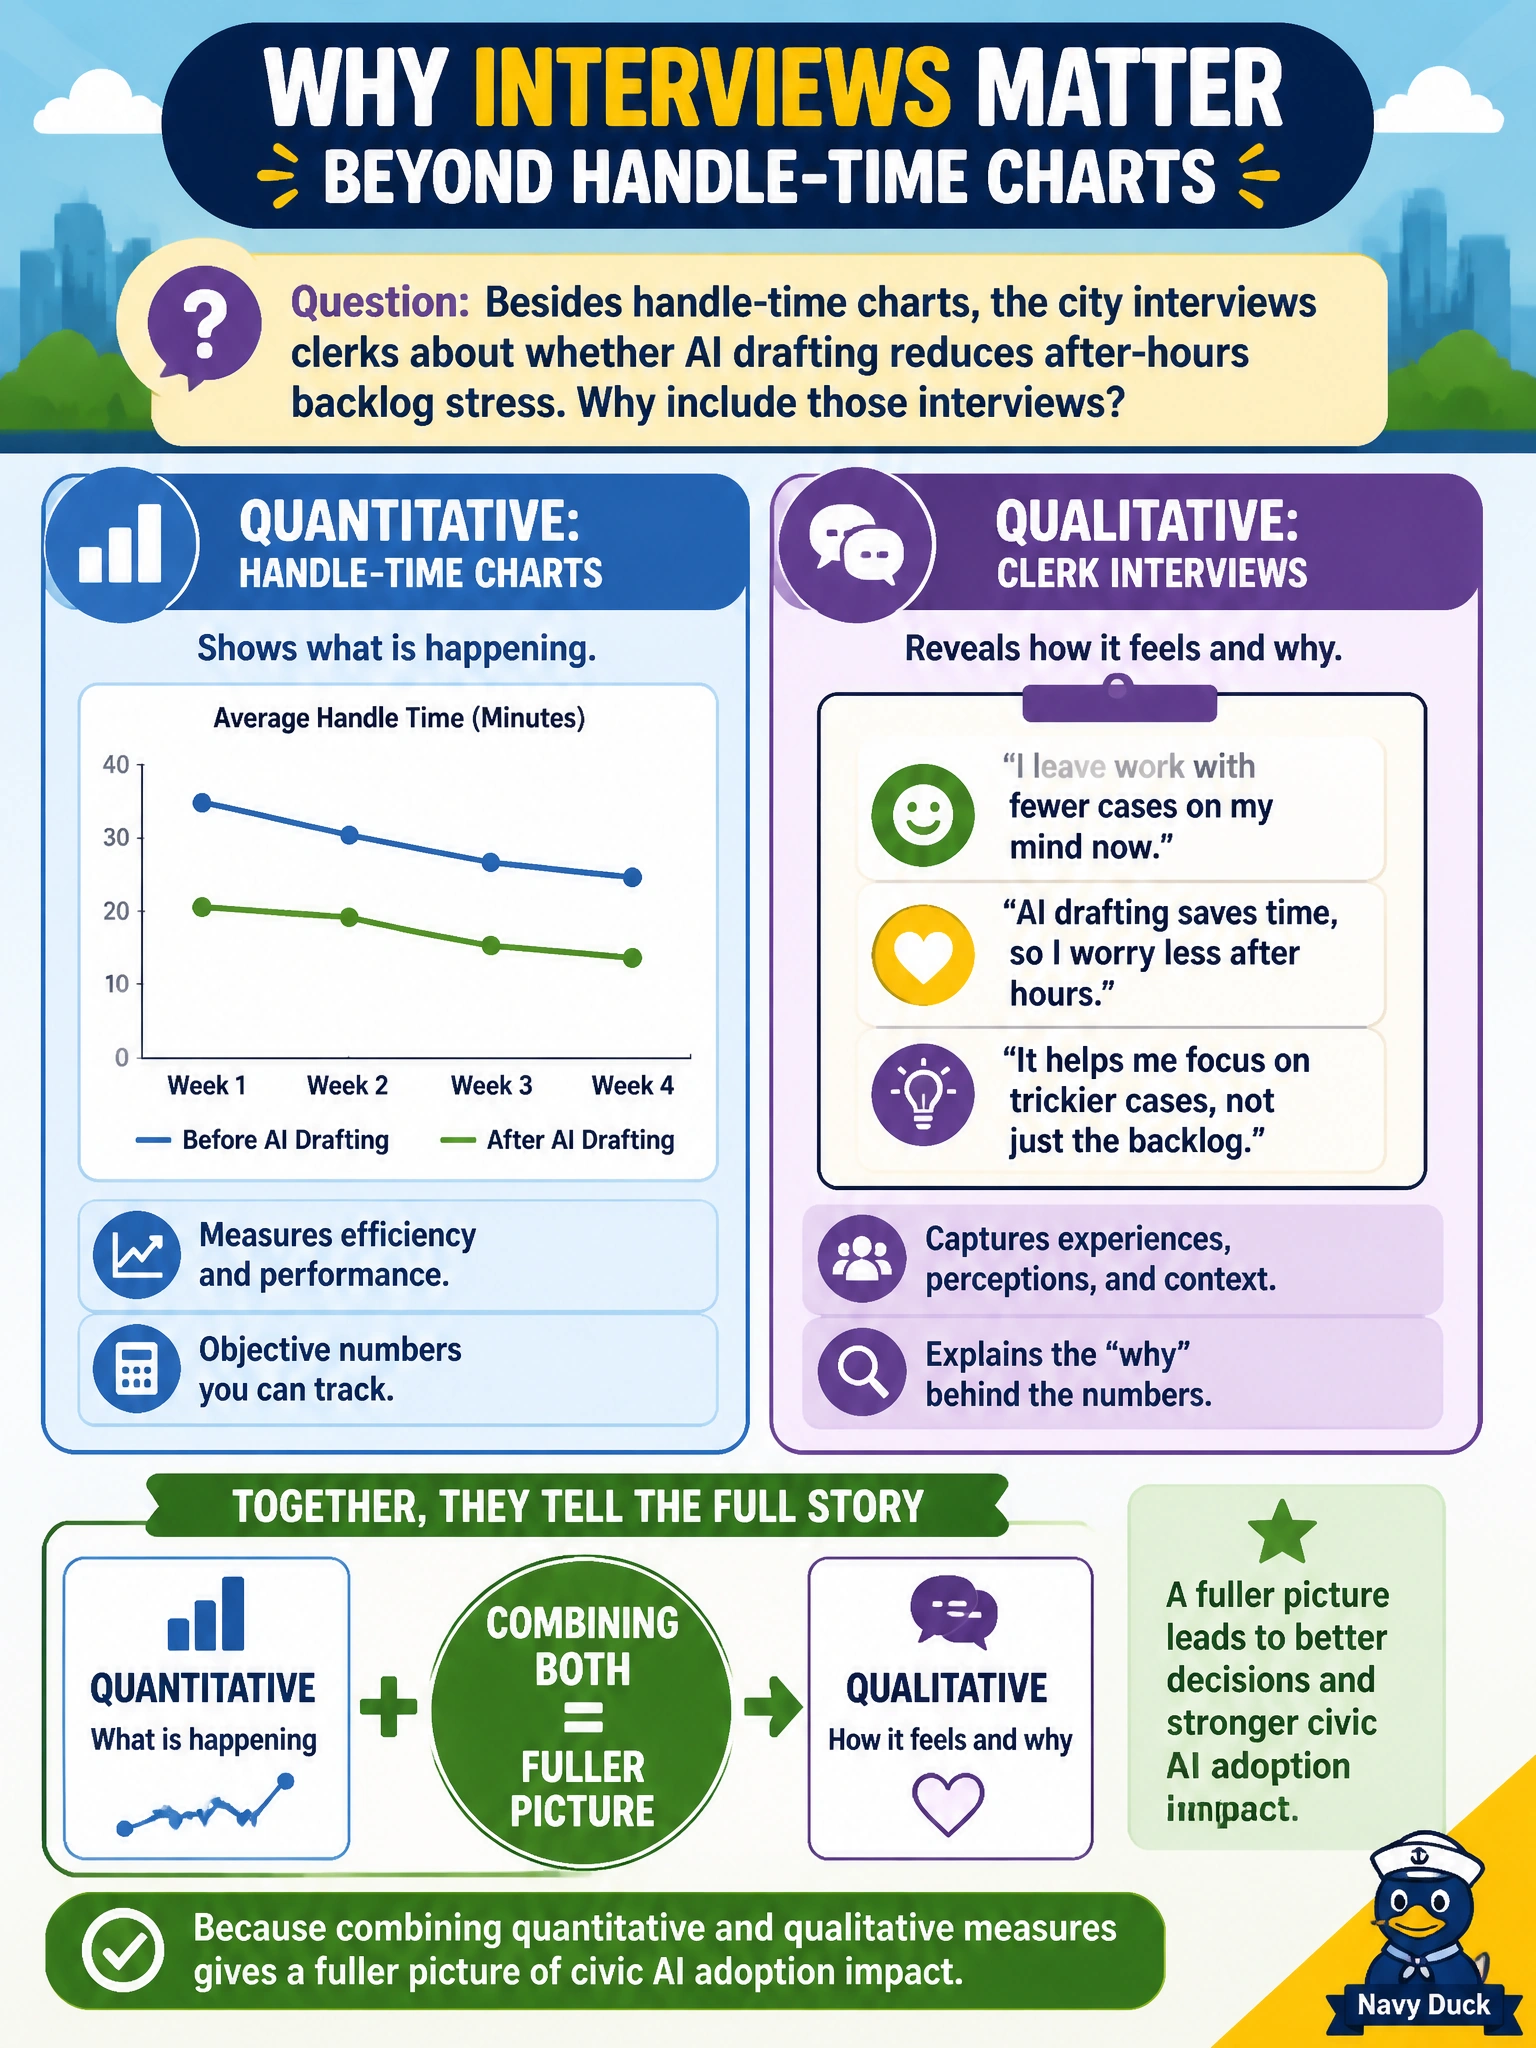
Besides handle-time charts, the city interviews clerks about whether AI drafting reduces after-hours backlog stress. Why include those interviews?
Select an answer to reveal the explanation.
Short Explanation
Numbers tell you the clock shrank; interviews tell you whether the night shift still feels crushed. Blend both and you see adoption impact in 3D, not flat.
Full Explanation
Adoption and impact measurement improves when quantitative operational metrics such as handle-time charts are paired with qualitative staff experience signals. Interviewing clerks about whether AI drafting reduces after-hours backlog stress reveals burnout, workaround, and trust effects that averages hide—time saved on paper may still leave evening queues feeling crushing if edge cases pile up or drafts need heavy repair. Combining quantitative and qualitative measures gives municipal leaders a fuller picture of whether AI adoption improved work life and service capacity. Replacing all quantitative metrics permanently with qualitative input alone loses comparability, trend detection, and auditability that finance and auditors expect. Claiming interviews alone satisfy auditors without any operational data usually fails formal oversight expectations. Asserting that stress narratives make dashboards unnecessary for program decisions discards essential operational telemetry needed to manage capacity. Exam caveat: items reward mixed-methods measurement for civic AI impact, not either/or ideology. Operational check: schedule structured clerk interviews or pulse surveys alongside KPI dashboards, code themes such as stress, trust, and rework, triangulate with handle-time and rework rates, and adjust enablement or model controls when qualitative pain rises even if average handle time improves.