
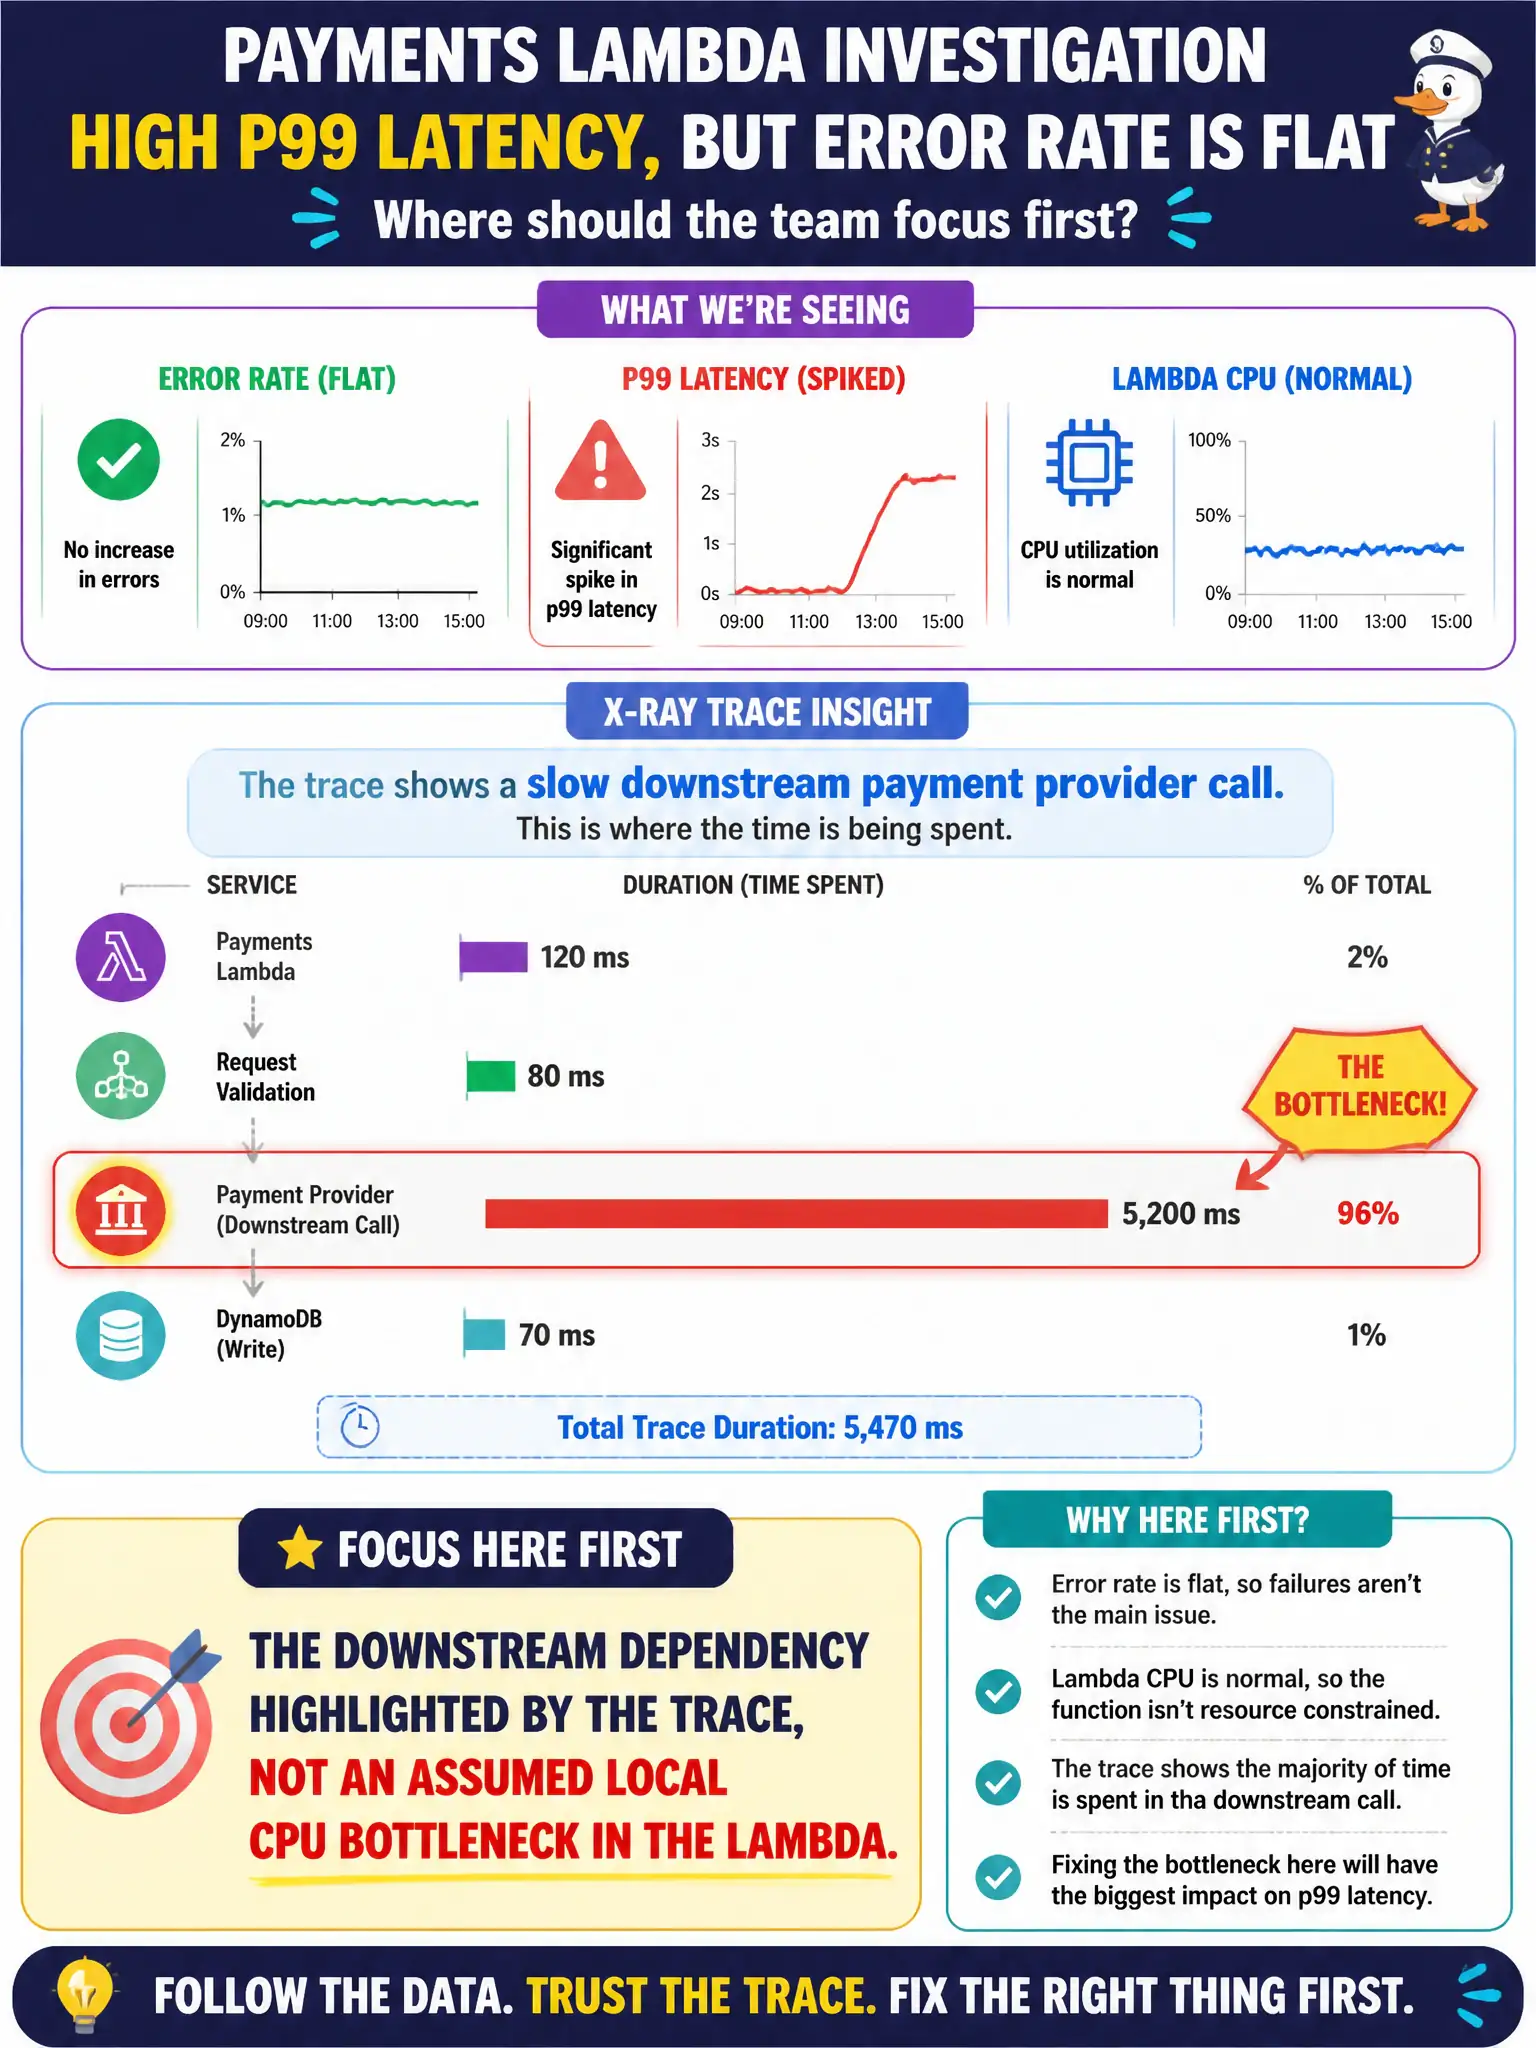
Error rate for a city payments Lambda is flat, but p99 latency spiked. X-Ray shows a slow downstream payment provider call rather than elevated Lambda CPU. Where should the team focus first?
Select an answer to reveal the explanation.
Short Explanation
Flat errors plus a p99 spike is a traffic jam, not a crash. X-Ray pointing at the payment provider means look downstream first—do not blame the Lambda CPU when the trace already named the slow neighbor.
Full Explanation
If error rate for a city payments Lambda is flat but p99 latency spiked, and X-Ray shows a slow downstream payment provider call rather than elevated Lambda CPU, the team should focus first on that downstream dependency. Latency incidents are often waiting on remote systems; traces prevent a mistaken local-CPU narrative when the provider's response time dominates the citizen checkout path and errors remain unchanged.
Only vertically scaling Lambda memory without reading traces may waste spend if the bottleneck is external wait time rather than local compute. Deleting all CloudWatch log groups does not reduce latency and destroys forensic evidence. Rewriting DynamoDB table names because "latency always means a wrong table name" ignores the X-Ray evidence pointing at the payment provider hop.
Exam caveat: use traces to separate local compute time from downstream wait; memory increases help CPU-bound or allocation-bound code, not necessarily third-party vendor latency.
Operational check: open the X-Ray service map and traces for slow payments, quantify provider call duration versus local work, engage the vendor or add timeouts, circuit breaking, or caching as appropriate, and re-check p99 after changes while keeping error-rate dashboards visible.