In a regression model's evaluation report, what does the R-squared value actually tell you?
Select an answer to reveal the explanation.
Short Explanation and Infographic
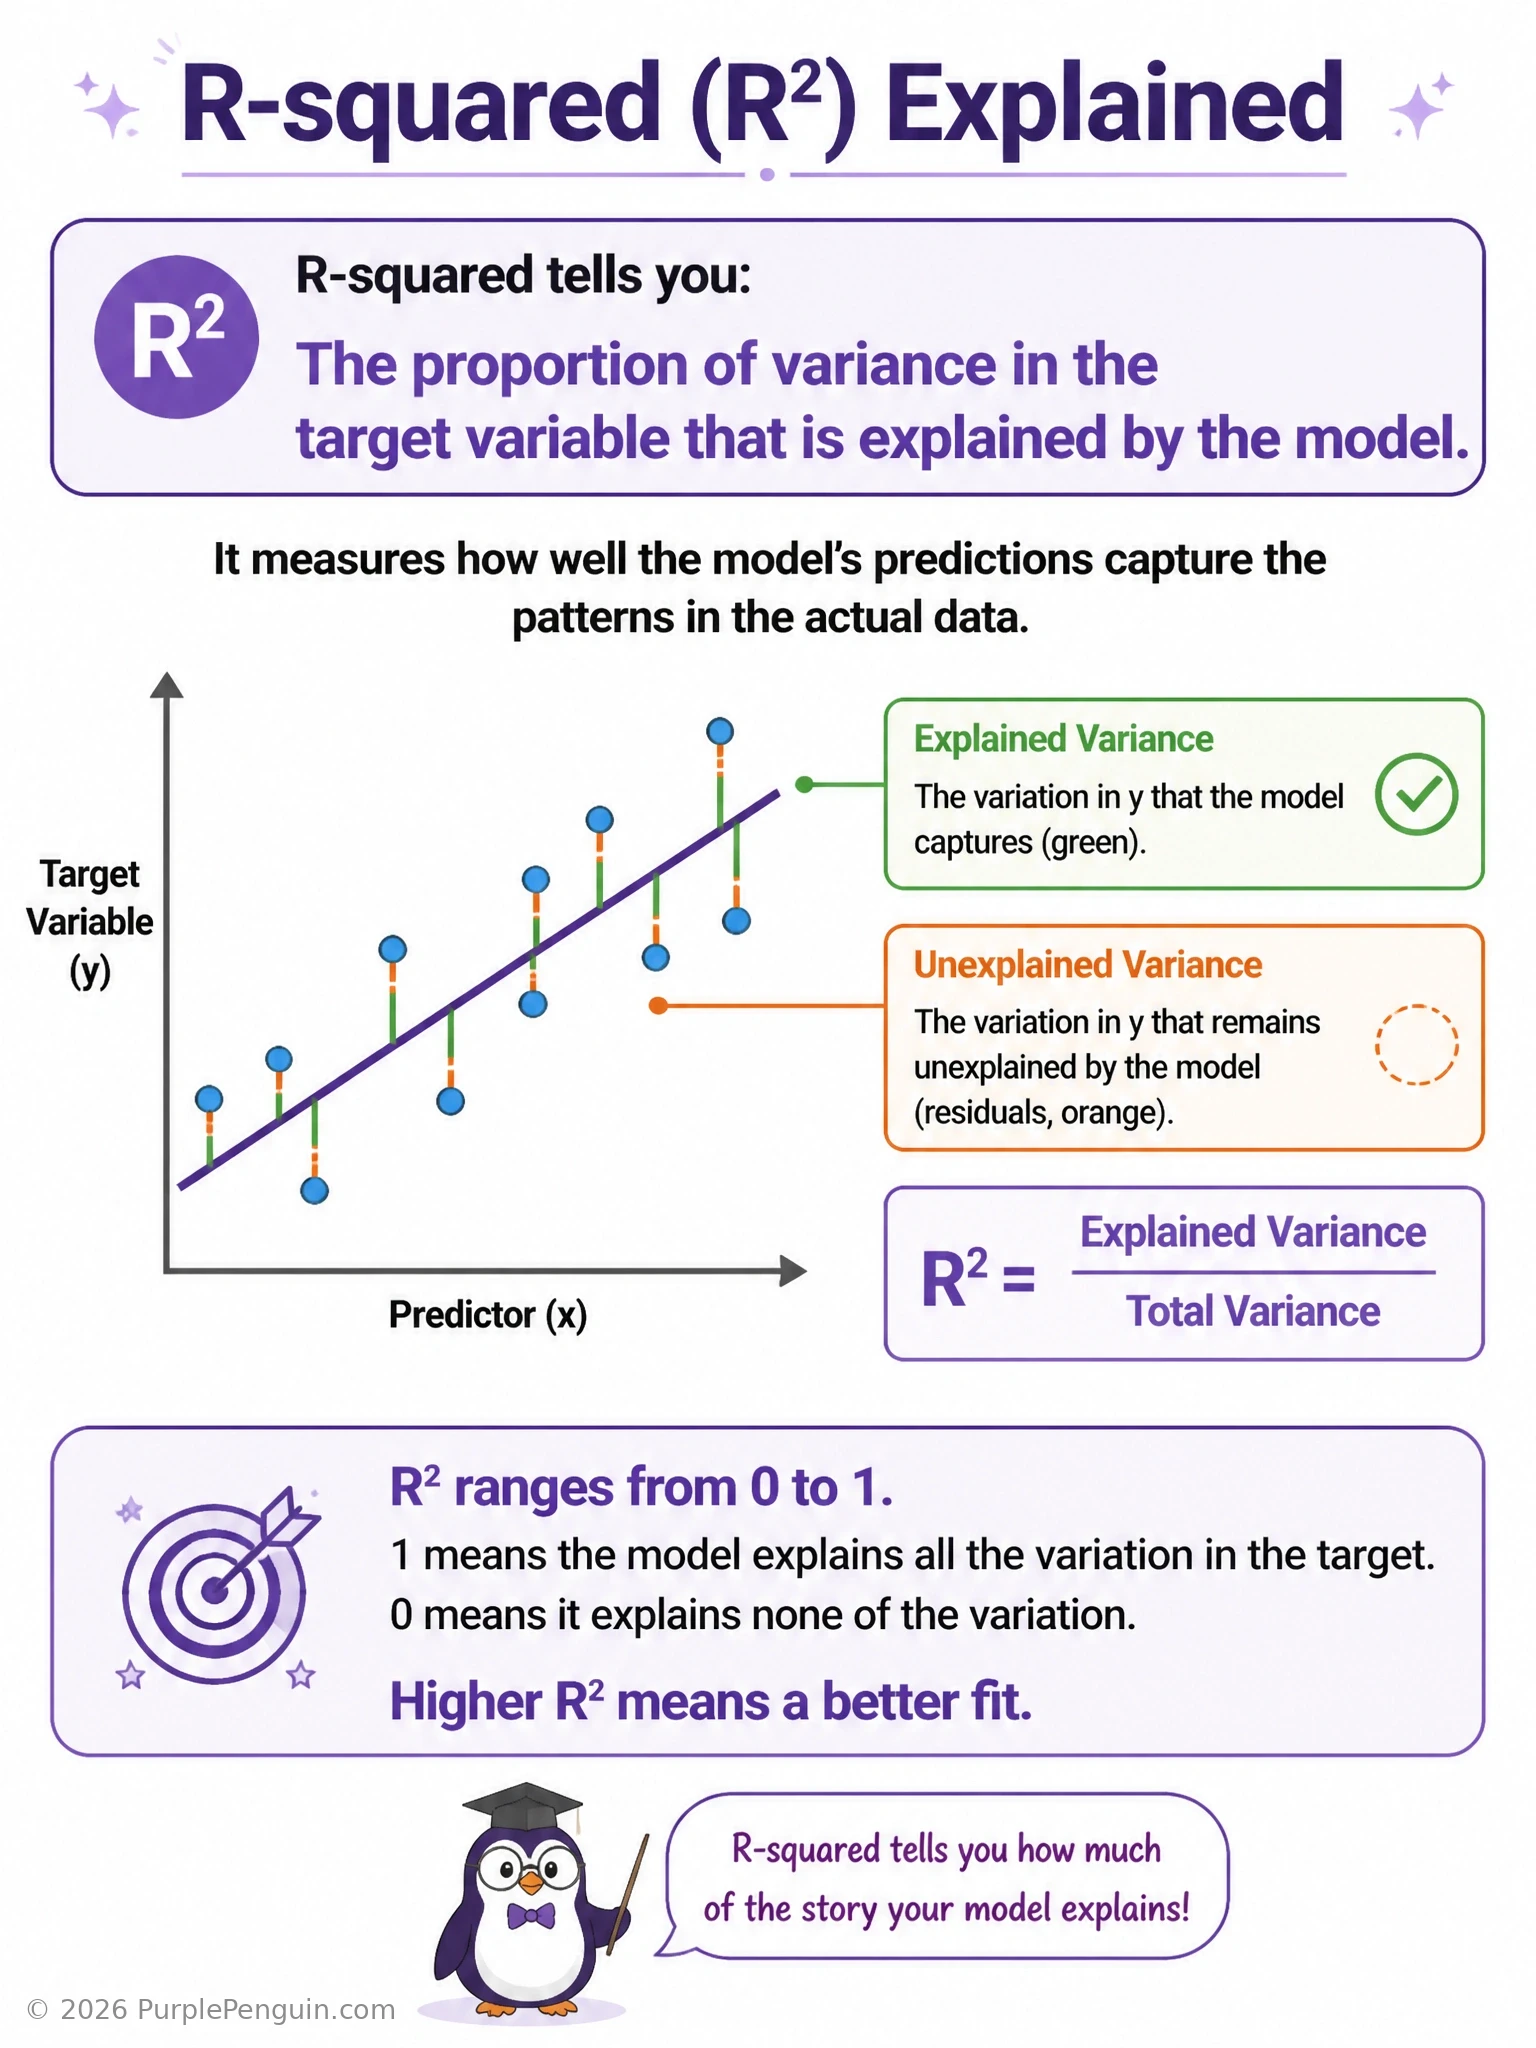
R-squared is basically asking one question: how much of the up-and-down movement in your target variable did the model actually manage to explain, versus how much is just left over as unexplained noise? An R-squared of 0.85 means the model accounts for 85% of the variance in the outcome, and the remaining 15% is residual variance the features didn't capture. That's answer B. It's not a percentage of 'close enough' predictions — that's a totally different kind of accuracy metric with its own threshold. It's not measured in the original units either, so it can't be describing average error size in dollars, degrees, or whatever your target is — that's what something like MAE or RMSE is for. And it has nothing to do with statistical significance of coefficients — that's a job for p-values and confidence intervals, not R-squared. R-squared is purely about variance explained, full stop.
Full explanation below image
Full Explanation
R-squared, also called the coefficient of determination, quantifies the proportion of variance in the dependent (target) variable that is explained by the independent variables in a regression model. It is calculated as 1 minus the ratio of the sum of squared residuals (unexplained variance) to the total sum of squares (total variance in the target around its mean). An R-squared of 0 means the model explains none of the variance beyond simply predicting the mean, while an R-squared of 1 means the model explains all of the variance perfectly. Values in between represent the fraction of variability accounted for, so an R-squared of 0.70 means 70% of the variance in the target is explained by the model's features, with the remaining 30% left as unexplained residual variance.
The first distractor describes a threshold-based accuracy metric, something closer to a custom tolerance-band accuracy score, not R-squared, which is a variance-based statistic and has no built-in notion of 'close enough' or standard deviation bands. The second distractor confuses R-squared with error magnitude metrics reported in the target's original units, such as mean absolute error (MAE) or root mean squared error (RMSE); R-squared is unitless and dimensionless by design, expressed purely as a proportion between 0 and 1 (or occasionally negative for very poor models), precisely so it can be compared across problems with different scales. The third distractor describes statistical hypothesis testing on individual coefficients, which is assessed through p-values, t-statistics, and confidence intervals from the regression's inferential statistics, an entirely separate concept from how much variance the overall model explains.
A useful way to remember R-squared is to think of it as a 'grade' for how much of the story in your data the model is telling: high R-squared means the model captures most of what drives the outcome, low R-squared means most of the variation remains a mystery to the model. One caveat worth knowing is that R-squared can be artificially inflated by simply adding more features, even irrelevant ones, which is why adjusted R-squared is often preferred when comparing models with different numbers of predictors, since it penalizes unnecessary complexity that doesn't genuinely improve variance explained.