A data scientist is exploring a feature such as annual household income, where most values cluster at the lower end but a small number of values extend far into the millions. Under what condition is it generally most appropriate to apply a log scale (or log transform) to a feature like this?
Select an answer to reveal the explanation.
Short Explanation and Infographic
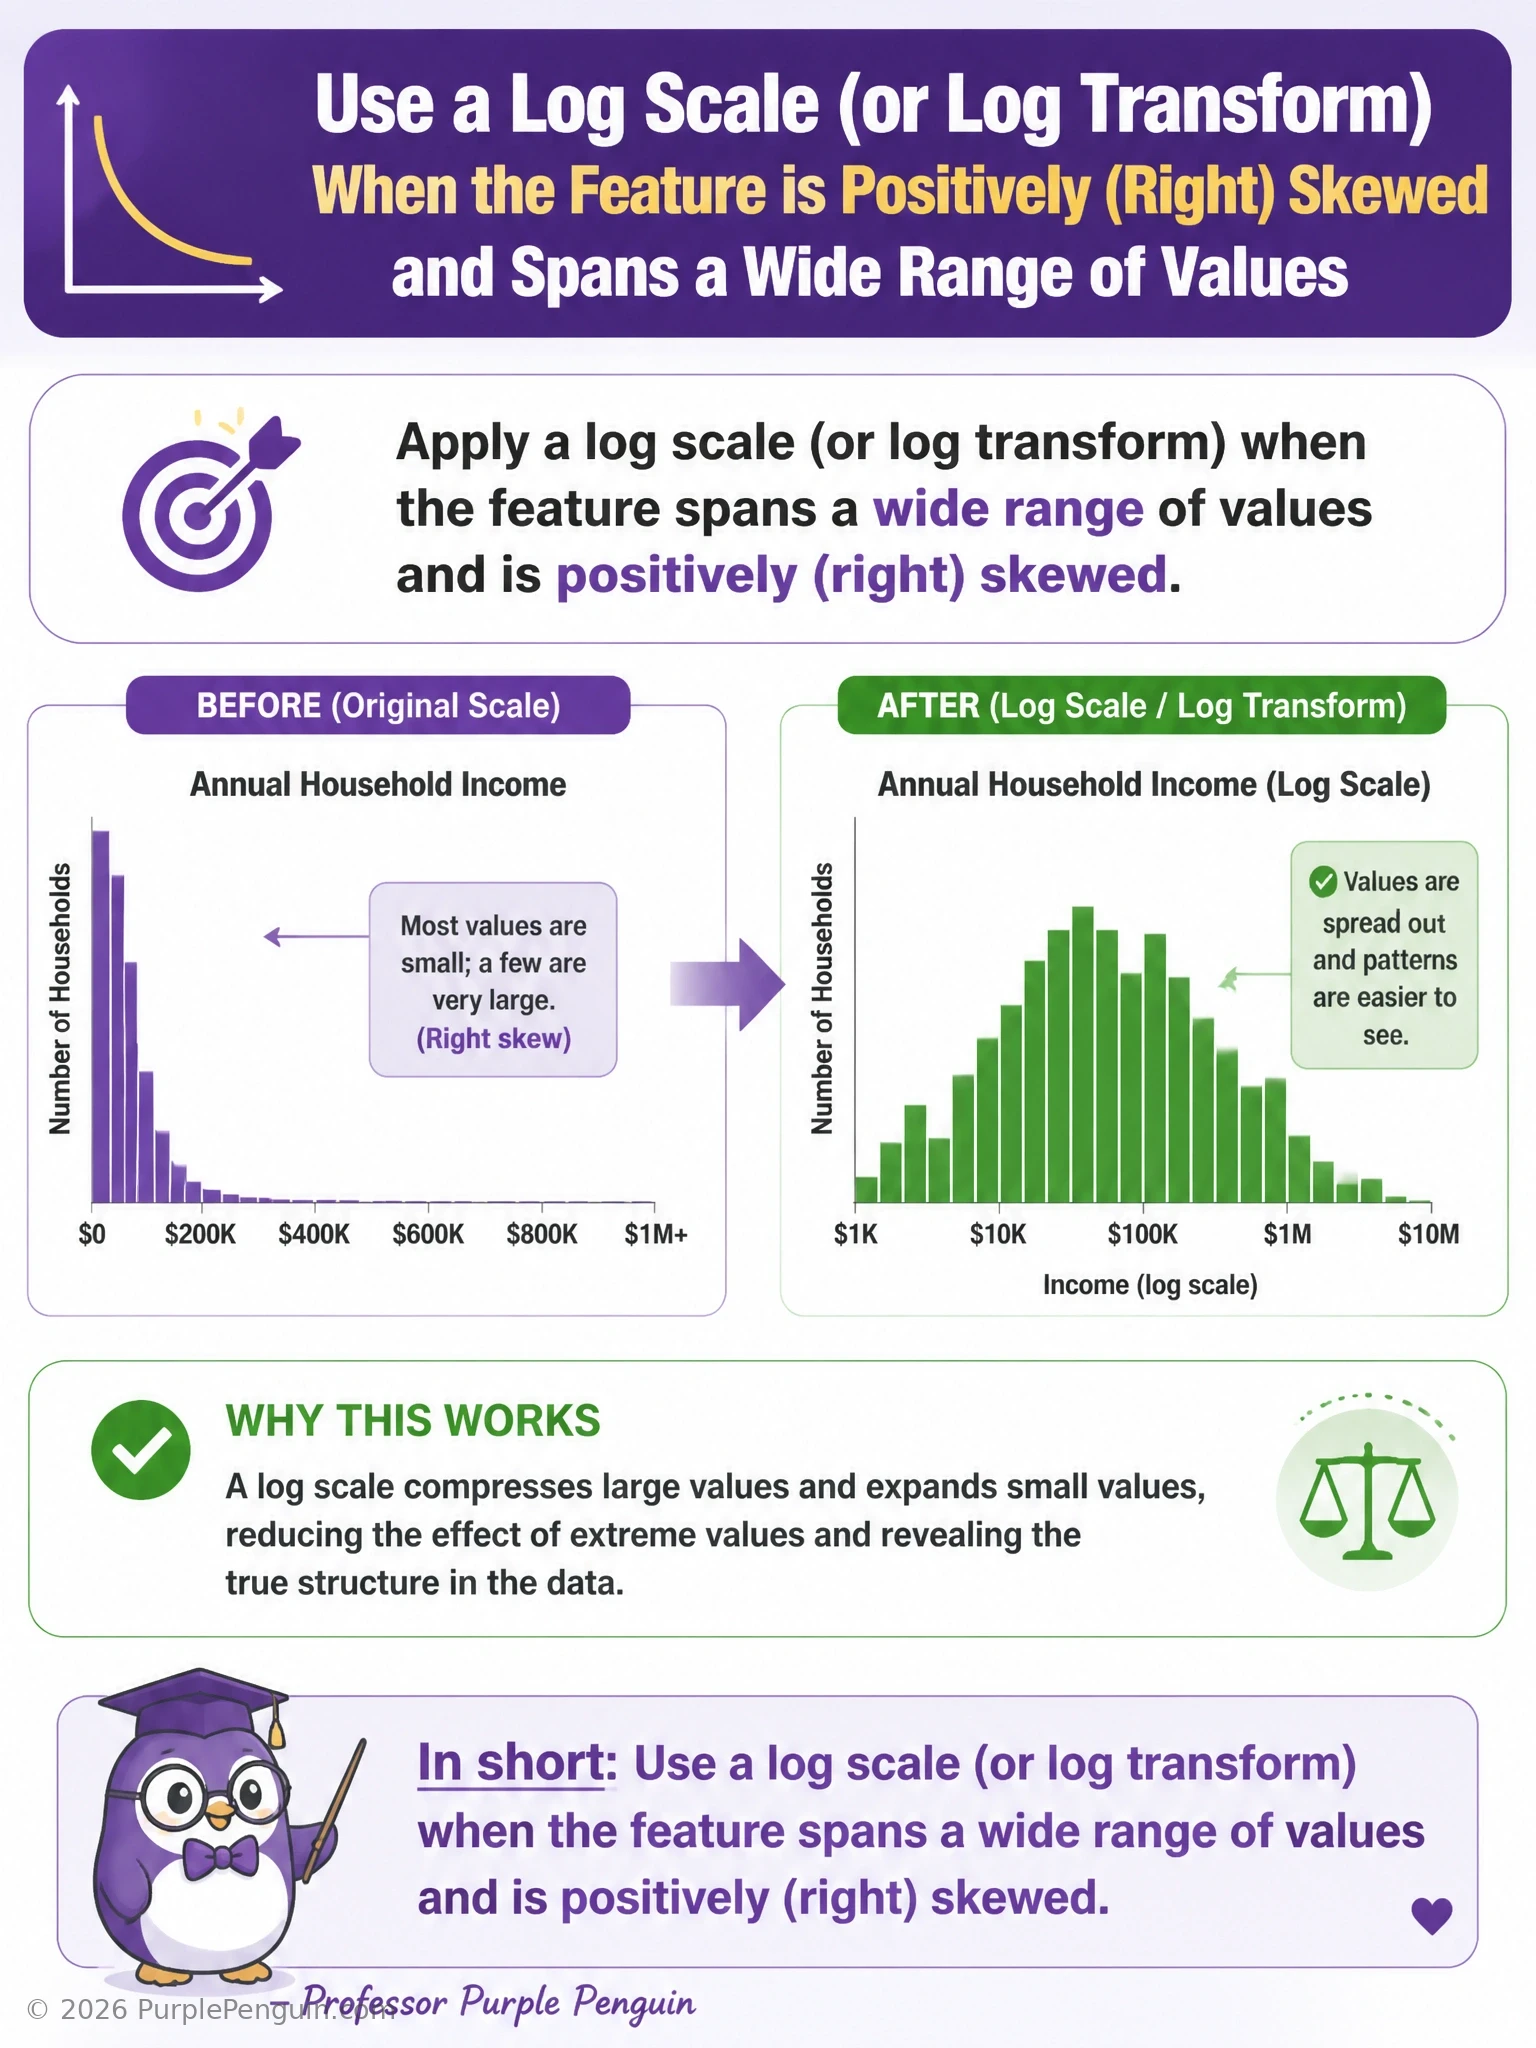
Picture that income histogram: a tall pile of ordinary incomes bunched on the left, then a long, thin tail stretching way out to the right where the millionaires live. That combination — huge range plus a long right tail, positive skew — is exactly when a log transform earns its keep. Taking the log compresses those huge outlier values and stretches out the crowded low end, making the distribution more symmetric and easier for models and visualizations to handle. So the right-skewed, wide-range answer is correct. A perfectly normal distribution doesn't need this treatment — it's already symmetric, so a log transform would just distort it unnecessarily. A narrow range clustered near zero doesn't need compressing since there's no wide spread to tame, and applying a log there can actually create instability near zero. And log transforms are undefined for negative numbers, so a feature centered around a mean with negative values evenly distributed simply can't take a plain log transform at all.
Full explanation below image
Full Explanation
A log scale or log transform is most appropriate when a feature spans several orders of magnitude and exhibits positive (right) skew, meaning the bulk of values are relatively small while a minority of extreme values stretch the distribution's tail far to the right, as is typical of income, population, or price data. Applying a logarithm compresses the scale of large values much more than small values, which pulls in the long right tail, reduces the influence of extreme outliers on distance-based or gradient-based algorithms, and often makes the resulting distribution closer to symmetric or normal, improving model performance and interpretability of visualizations.
The option describing a perfectly normally distributed feature with no outliers is incorrect because a log transform is unnecessary, and often counterproductive, when data is already symmetric and well-behaved; transforming it further would distort relationships without providing any benefit, since there is no skew or extreme range to correct.
The option describing a narrow, tightly clustered range of values near zero is incorrect because the entire motivation for a log transform is to handle a wide range of magnitudes; when values are already clustered in a small range, there is no scale problem to fix, and applying a log transform to values very close to zero can introduce numerical instability (since log approaches negative infinity as values approach zero) without any corresponding benefit.
The option describing a feature with only negative values evenly distributed around a mean is incorrect for a more fundamental reason: the natural logarithm (and log base 10) is undefined for zero and negative numbers, so a direct log transform cannot even be applied to such data without first shifting or transforming it into positive territory. Additionally, an evenly distributed (symmetric) feature would not benefit from a skew-correcting transform in the first place.
Memory aid: reach for a log transform when you see 'long right tail, big range' — it is the standard fix for positively skewed, wide-range numeric features like income, price, or population.