A data scientist has a dataset with five numeric features and wants a single mathematical object that summarizes how much each feature varies and how each pair of features moves together. Which object should they compute?
Select an answer to reveal the explanation.
Short Explanation and Infographic
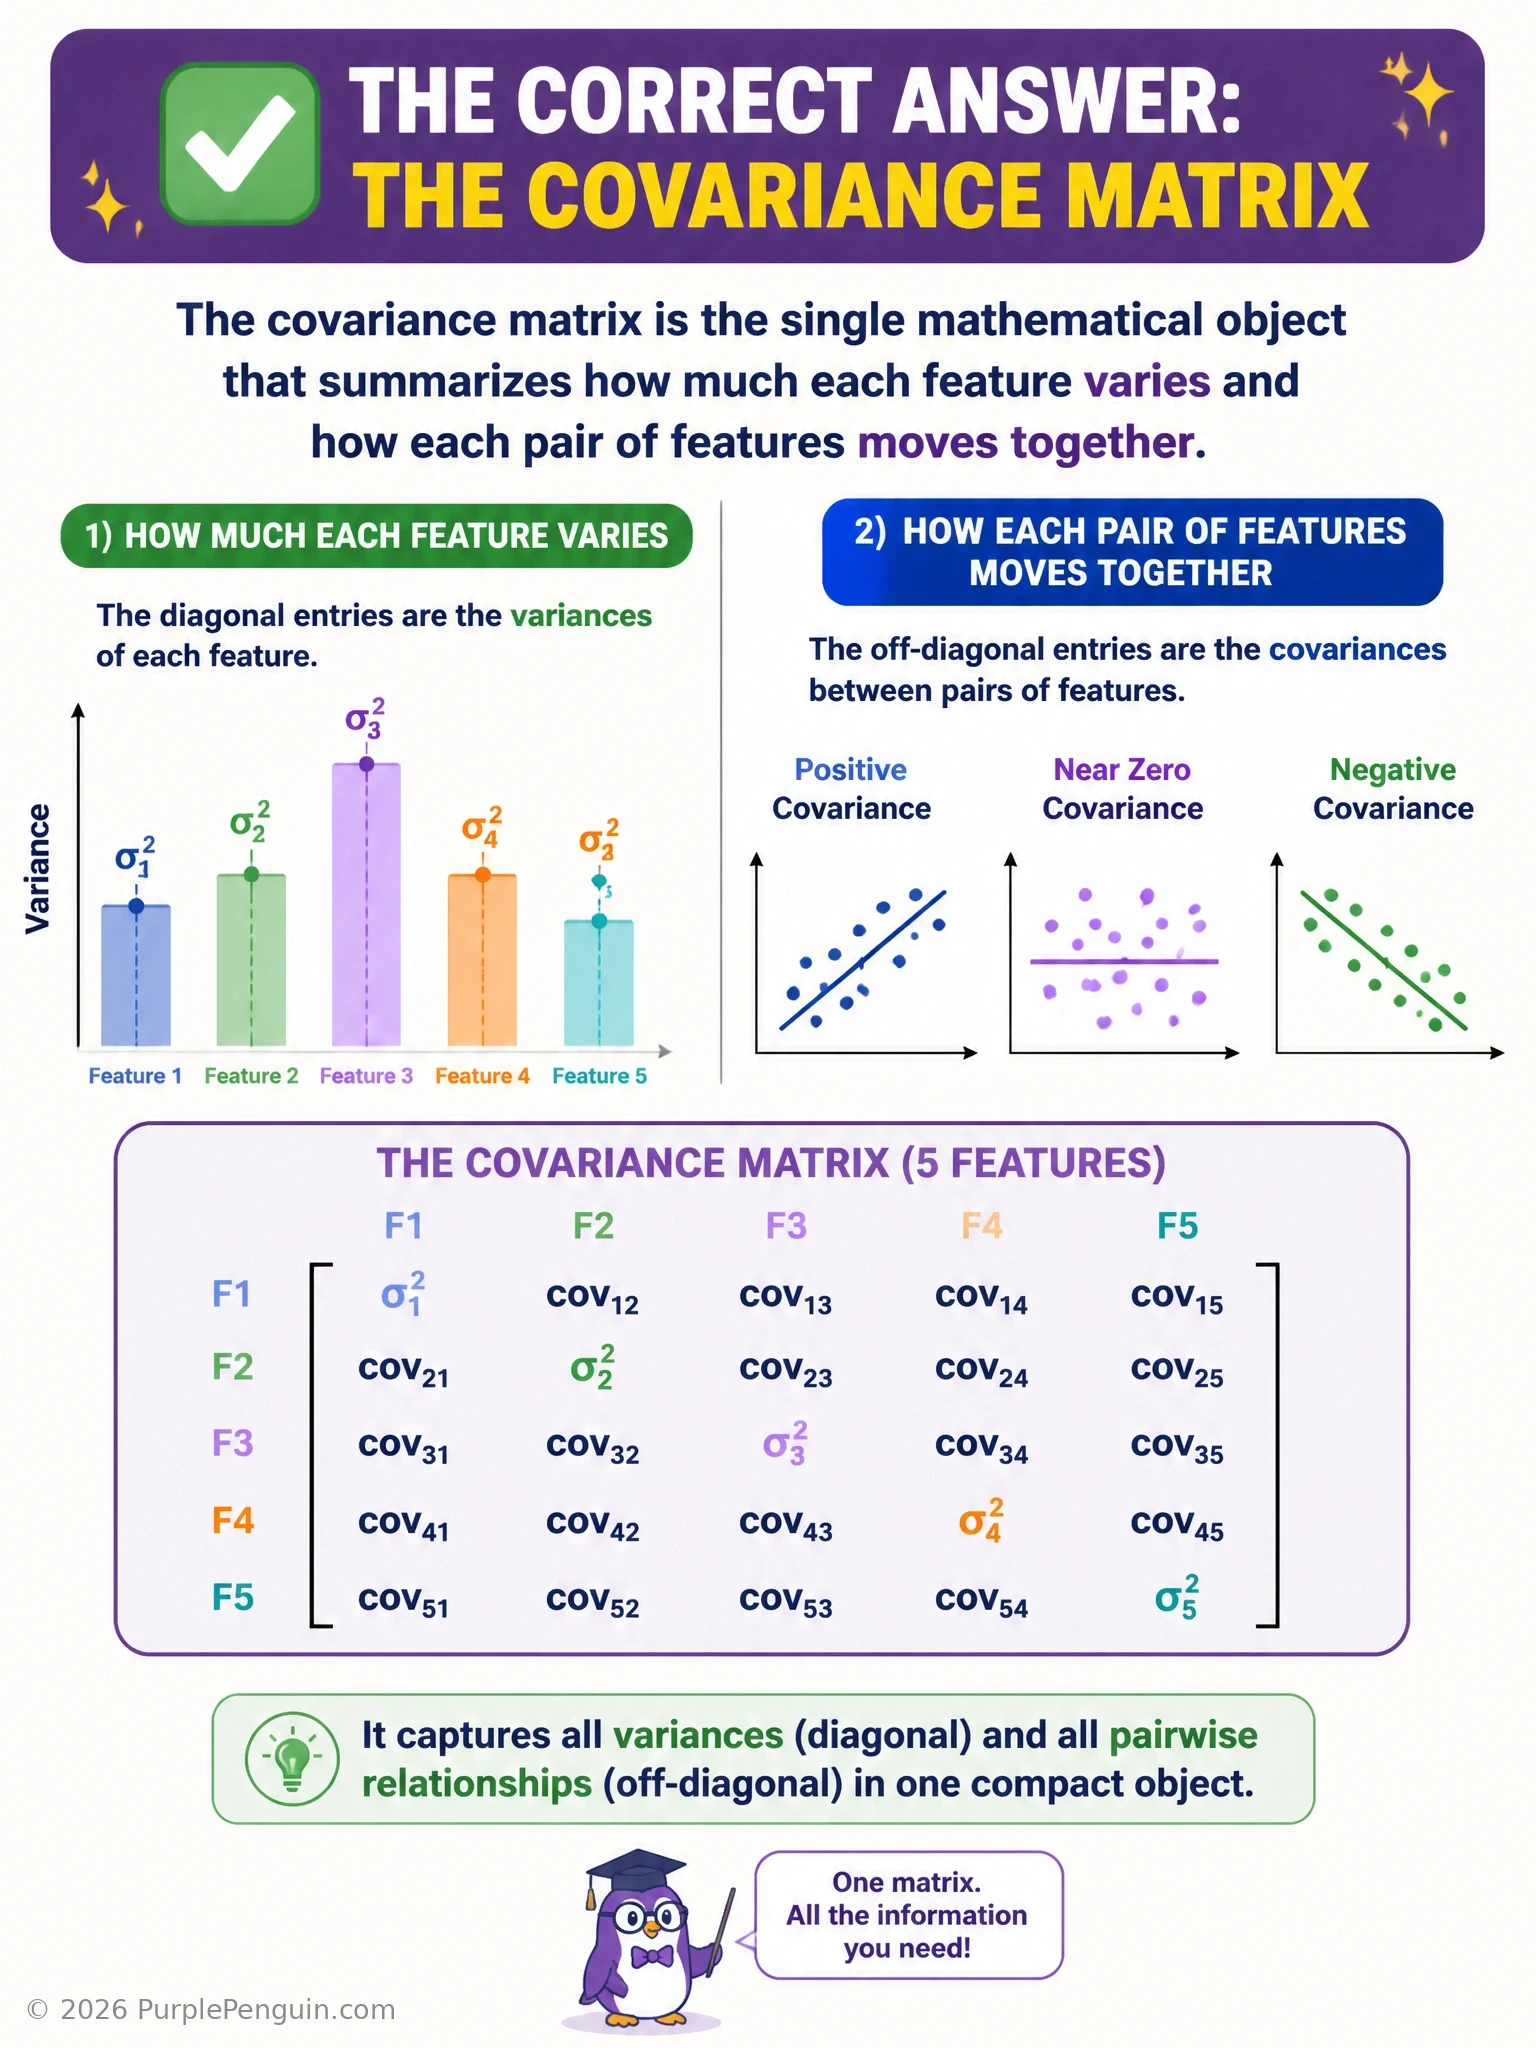
Think of the covariance matrix as a group photo of your features that shows not just how each one wiggles on its own, but how they wiggle together. Along the diagonal you get the variance of each individual feature, and off the diagonal you get the covariance between every pair, telling you whether they tend to rise and fall together, move in opposite directions, or ignore each other entirely. That's exactly what the data scientist needs here, so the covariance matrix is the answer. The identity matrix is just a placeholder matrix of ones on the diagonal and zeros elsewhere, with no data in it at all. A confusion matrix is a classification scorecard of predicted versus actual labels, totally unrelated to variable spread. And the Jacobian is a matrix of partial derivatives used in calculus and backprop, not a description of how raw features relate statistically.
Full explanation below image
Full Explanation
The covariance matrix is a square, symmetric matrix built from a dataset's numeric features where each diagonal entry is the variance of one feature (how spread out its values are around its own mean) and each off-diagonal entry is the covariance between a pair of features (whether they tend to increase together, decrease together, or show no consistent linear relationship). For n features, the result is an n-by-n matrix, and it is foundational to techniques like Principal Component Analysis, Gaussian modeling, and Mahalanobis distance, because it captures the full second-order structure of the data in one object.
The identity matrix is incorrect because it is a fixed matrix with 1s on the diagonal and 0s everywhere else; it holds no information about any particular dataset and is used as a neutral element in matrix multiplication, not as a statistical summary.
The confusion matrix is incorrect because it belongs to a completely different context: model evaluation for classification tasks. It tabulates counts of true positives, false positives, true negatives, and false negatives to assess predictive performance, and has nothing to do with describing the spread or co-movement of input features.
The Jacobian of the loss function is incorrect because it is a matrix of first-order partial derivatives of a vector-valued function with respect to its inputs, used in optimization and backpropagation to describe local sensitivity. It is a calculus construct tied to a specific function, not a descriptive statistic of a dataset's variables.
Memory aid: variance lives on the diagonal, covariance lives off the diagonal, and together they form the covariance matrix — the statistical fingerprint of how your features relate to one another.