Inside a convolutional layer, a learned filter slides across the input image and produces a 2D grid of output values. What is this resulting grid of values called?
Select an answer to reveal the explanation.
Short Explanation and Infographic
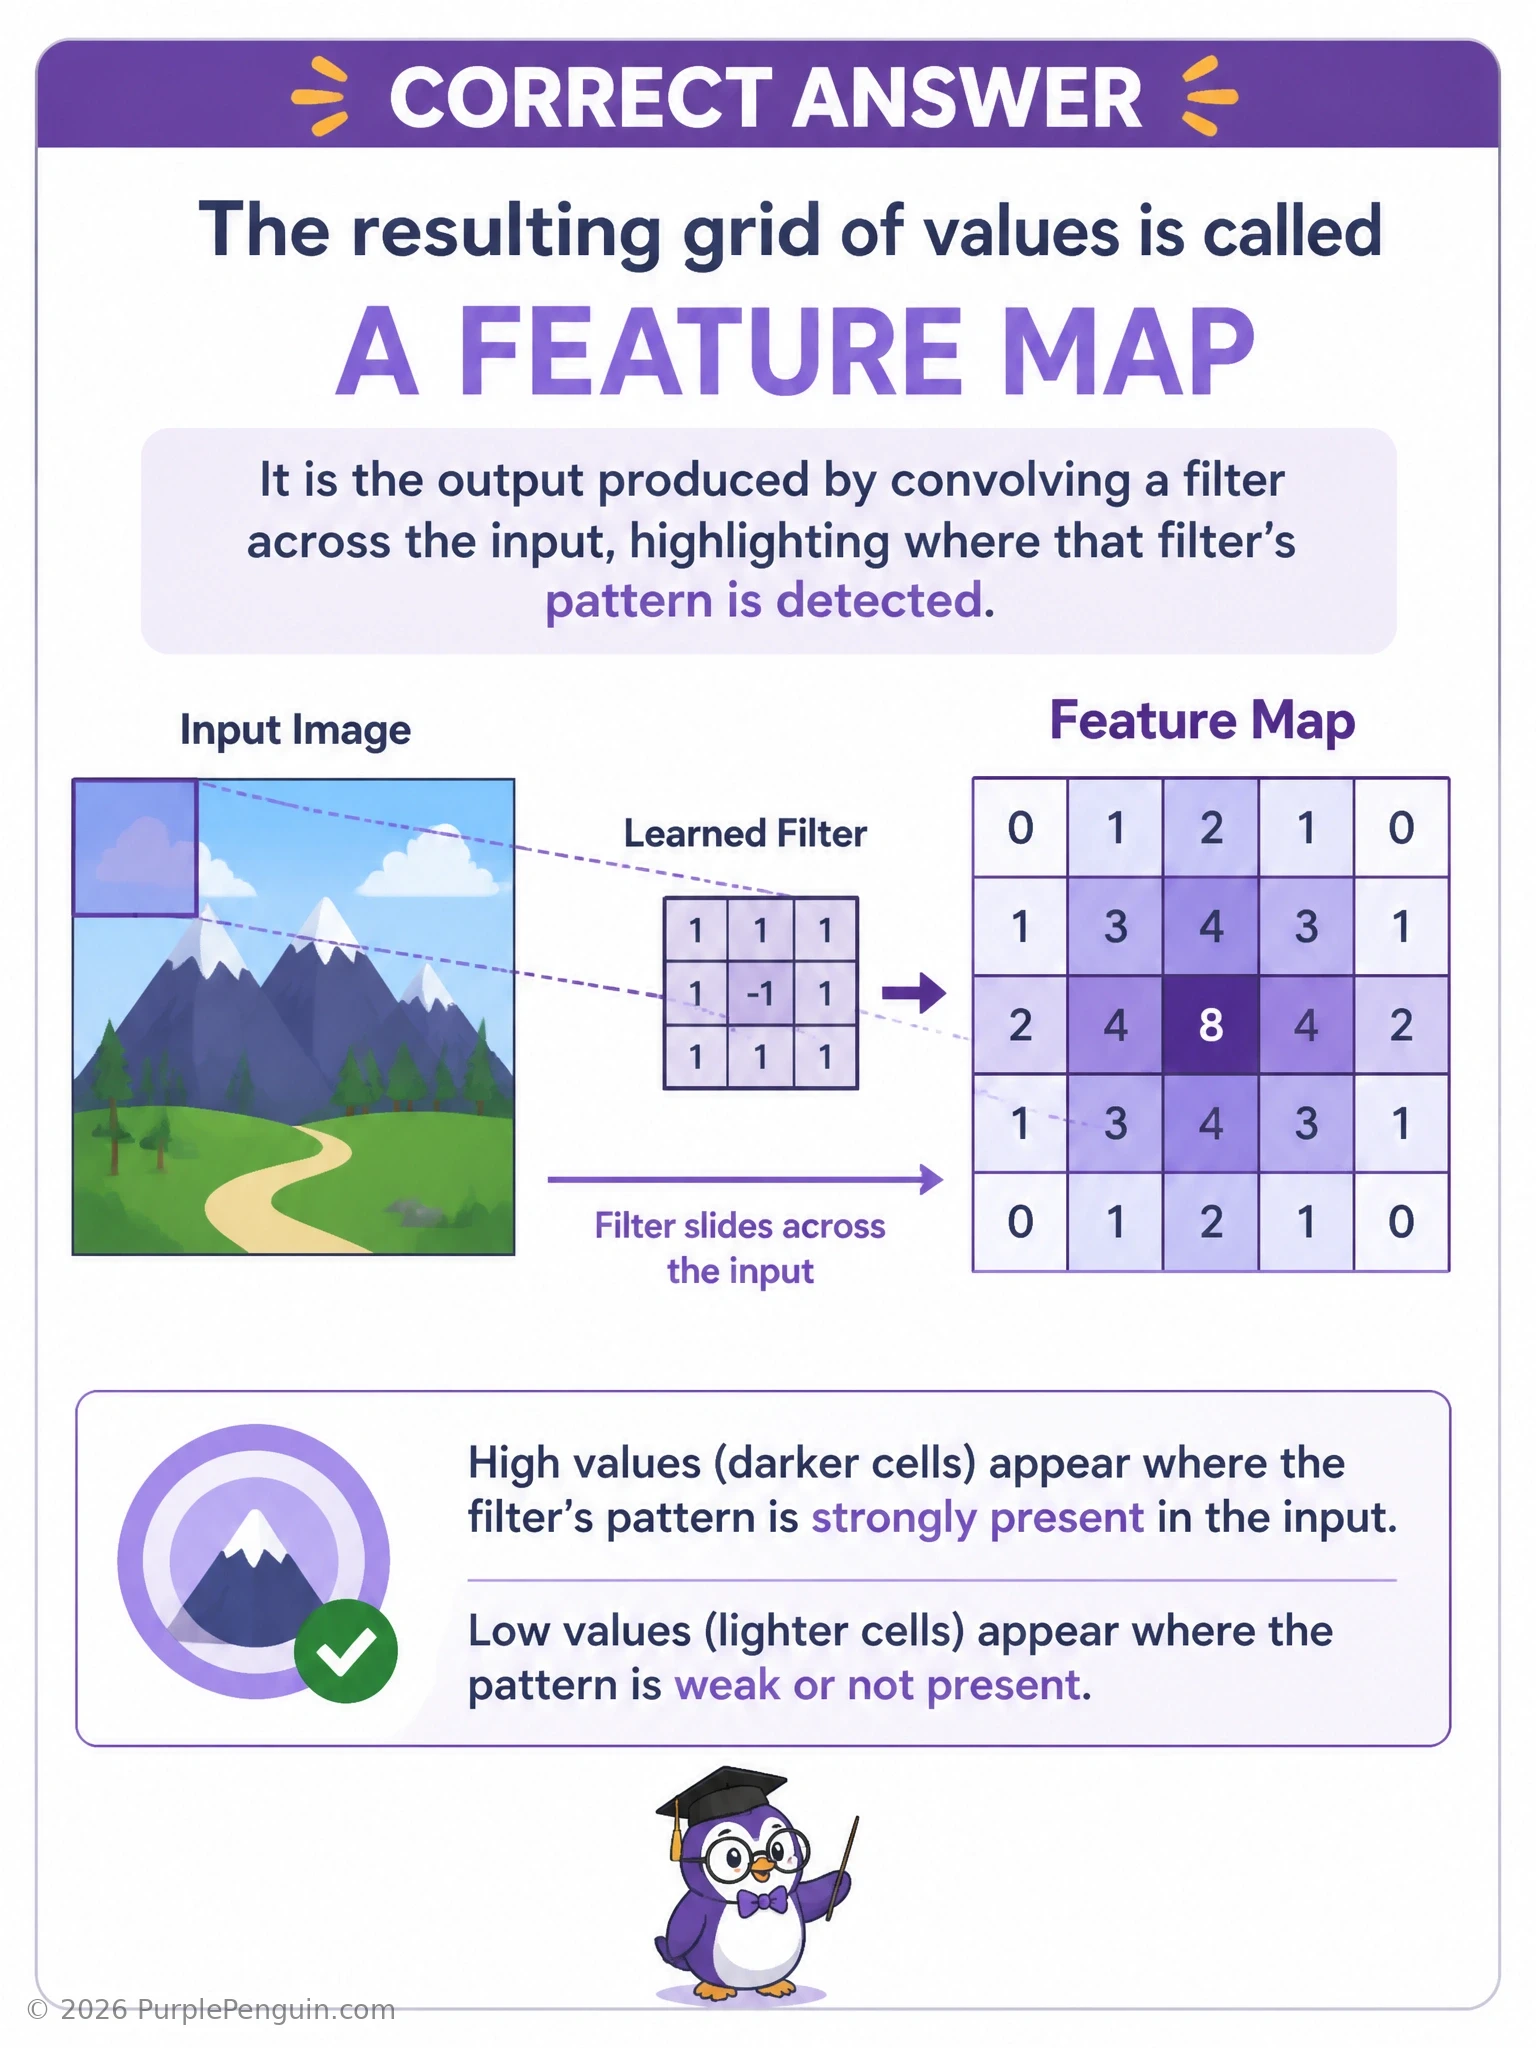
That grid of output values is called a feature map. As the filter slides across the image checking every local patch for its particular pattern — maybe a vertical edge, maybe a certain color blob — it leaves behind a value at each position saying how strongly that pattern showed up right there. Stack those position values together and you get a 2D grid, the feature map, essentially a heatmap of 'where did this filter's pattern appear.' A confusion matrix is a totally different animal — an evaluation tool comparing predicted versus actual classes, nothing to do with convolution output. A loss landscape is a conceptual visualization of how error changes across the space of possible weights, used for understanding optimization, not something a filter produces during a forward pass. And a learning rate schedule is just a plan for how the learning rate hyperparameter changes over training — unrelated to what a convolution operation produces.
Full explanation below image
Full Explanation
The correct answer is feature map, which is the standard term for the 2D (or higher-dimensional, if you count channels) array of activation values produced when a single convolutional filter is slid across the input, computing a dot product at each spatial position. Each value in the feature map indicates how strongly the pattern that the filter has learned to detect — such as a diagonal edge, a particular texture, or a color contrast — is present at that specific location in the input. A convolutional layer typically contains many filters, each producing its own feature map, and those multiple feature maps are stacked together to form the output volume passed to the next layer; early-layer feature maps tend to highlight low-level patterns like edges and corners, while deeper-layer feature maps, built from combinations of earlier ones, come to represent increasingly abstract and complex visual concepts like object parts or whole shapes. The first distractor, confusion matrix, is an entirely separate concept from model evaluation: it is a table that cross-tabulates predicted labels against true labels for a classification task, used to compute metrics like precision, recall, and accuracy per class — it has no connection to the intermediate spatial output produced by a single convolutional filter during the forward pass. The second distractor, loss landscape, refers to a conceptual (and sometimes literally visualized) surface representing how the loss function's value changes as a function of the model's weights, used by researchers to reason about optimization difficulty, sharp versus flat minima, and training dynamics — it is an abstract analytical tool, not a concrete tensor output produced by a filter operating on an image. The third distractor, learning rate schedule, describes a predefined or adaptive plan for how the learning rate hyperparameter changes across training steps or epochs, such as step decay or cosine annealing — this is purely about the optimization process governing weight updates and has nothing to do with the spatial output a convolution produces. A useful memory aid: think of a feature map as a spotlight scan across the image, with brighter spots marking exactly where the filter's specific pattern was found, which is why stacking many feature maps from many filters lets a CNN build a rich, layered understanding of an image's content.