
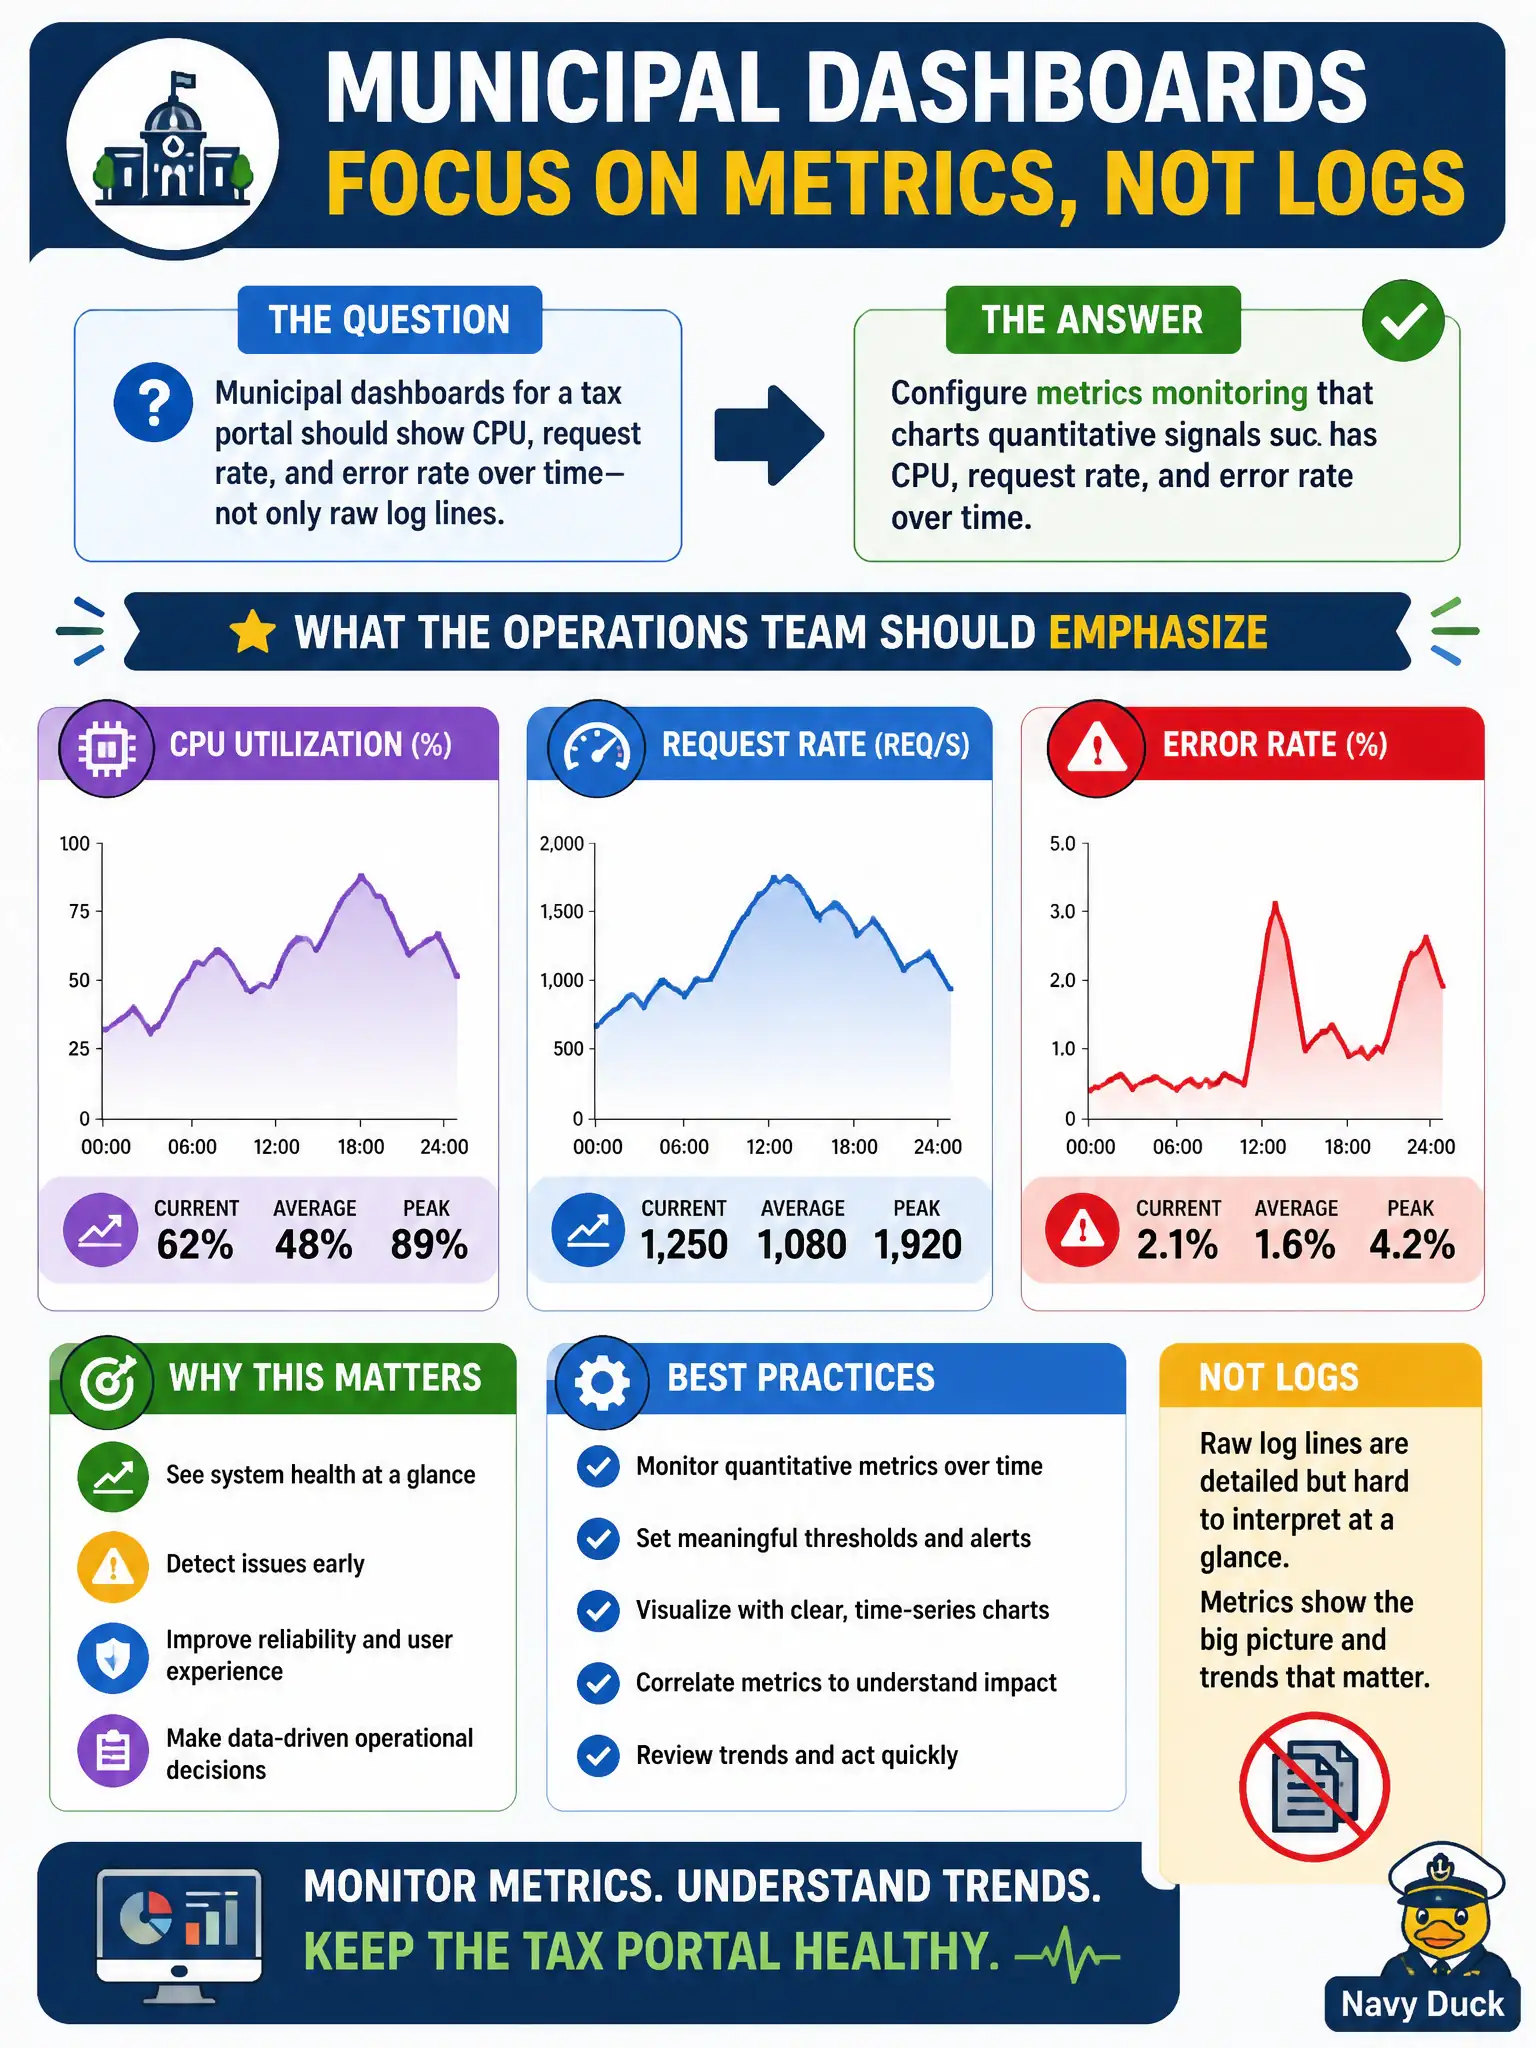
Municipal dashboards for a tax portal should show CPU, request rate, and error rate over time—not only raw log lines. What should the operations team emphasize?
Select an answer to reveal the explanation.
Short Explanation
Logs are the diary; metrics are the dashboard gauges you glance at while driving. CPU, request rate, and error rate over time tell you health at a glance without reading every line. Good ops boards mix both, but quantitative time series belong on the dashboard.
Full Explanation
Metrics monitoring that charts quantitative signals such as CPU, request rate, and error rate over time is what municipal tax-portal dashboards need—not only raw log lines. Replacing all metrics with full packet captures for ninety days fails cost and dashboard usability for trends. Disabling time-series collection and relying solely on unstructured log grepping fails quantitative trend views. Exporting screenshots of the console once a month instead of live charts fails continuous monitoring. Exam caveat: metrics are time-series quantitative signals; logs remain complementary but are not a substitute for those charts. Operational check: define RED/USE-style panels, set retention for metrics, alert on error rate, and review dashboards before tax deadlines. In municipal platform operations, record the chosen control and the rejected alternatives in the change record so future on-call engineers understand the failure modes avoided for citizen services. Re-check the decision after the next provider feature change or compliance update to ensure the same answer still holds for the city's estate. Confirm monitoring, access reviews, and backup coverage still align with the selected approach before closing the civic hypercare period.