
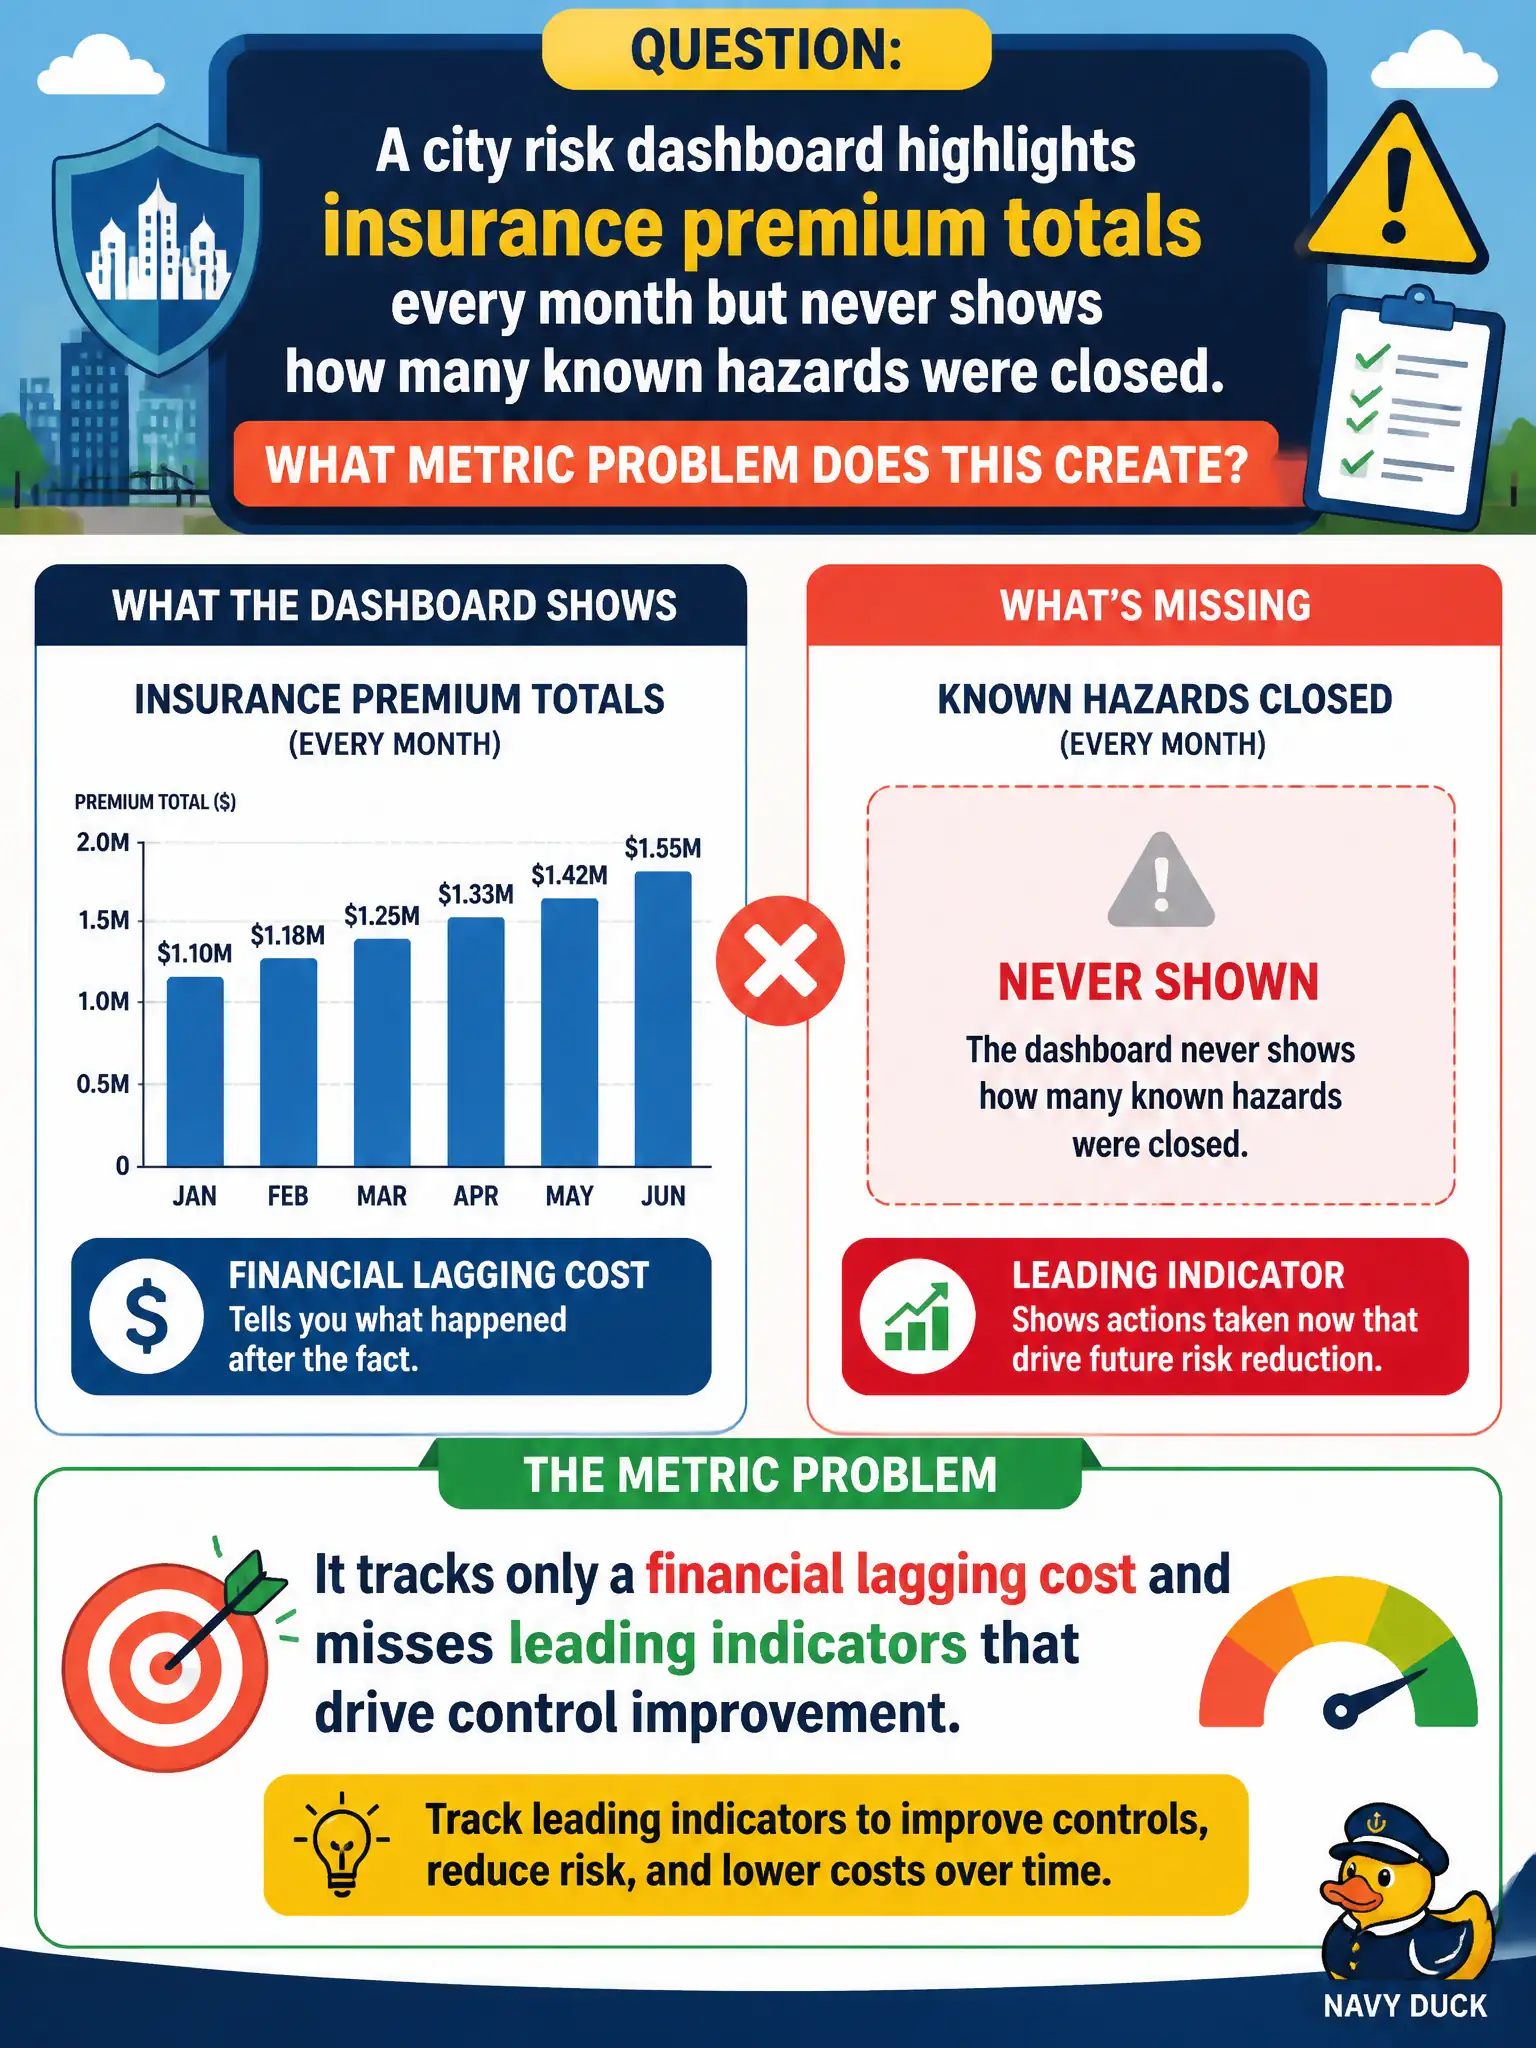
A city risk dashboard highlights insurance premium totals every month but never shows how many known hazards were closed. What metric problem does this create?
Select an answer to reveal the explanation.
Short Explanation
Think of premiums as the grocery receipt after you already burned dinner. Useful risk dashboards still need the stove knobs—closure rates and open hazards—so the team can fix stuff before the next bill arrives.
Full Explanation
Insurance premium totals are lagging financial indicators. A city risk dashboard that highlights premiums every month but never shows how many known hazards were closed tracks cost after the fact and misses leading indicators that drive control improvement. Continuous improvement for municipal risk needs operational metrics—hazard closure, corrective-action aging, near-miss trends—alongside financial summaries so leaders can see whether exposure is actually being reduced.
Claiming premium totals automatically prove every hazard is already closed confuses insurer pricing with local remediation progress. Excluding operational metrics from dashboards to stay “compliant with ISO 31000” misreads the standard, which supports informed decision-making rather than forbidding operational measures. Parking hazard closure rates only on contractor invoices hides improvement signal from civic risk governance.
Exam caveat: distinguish lagging financial costs from leading operational improvement metrics. Premiums alone are incomplete ERM/CI reporting.
Operational check: add hazard-closure and open-action aging widgets to the municipal dashboard; review them with premiums in the same leadership packet; investigate periods where premiums look stable while closures stall.