
A city CISO asks what BloodHound-class AD graphing tools are for. Which explanation is accurate?
Select an answer to reveal the explanation.
Short Explanation
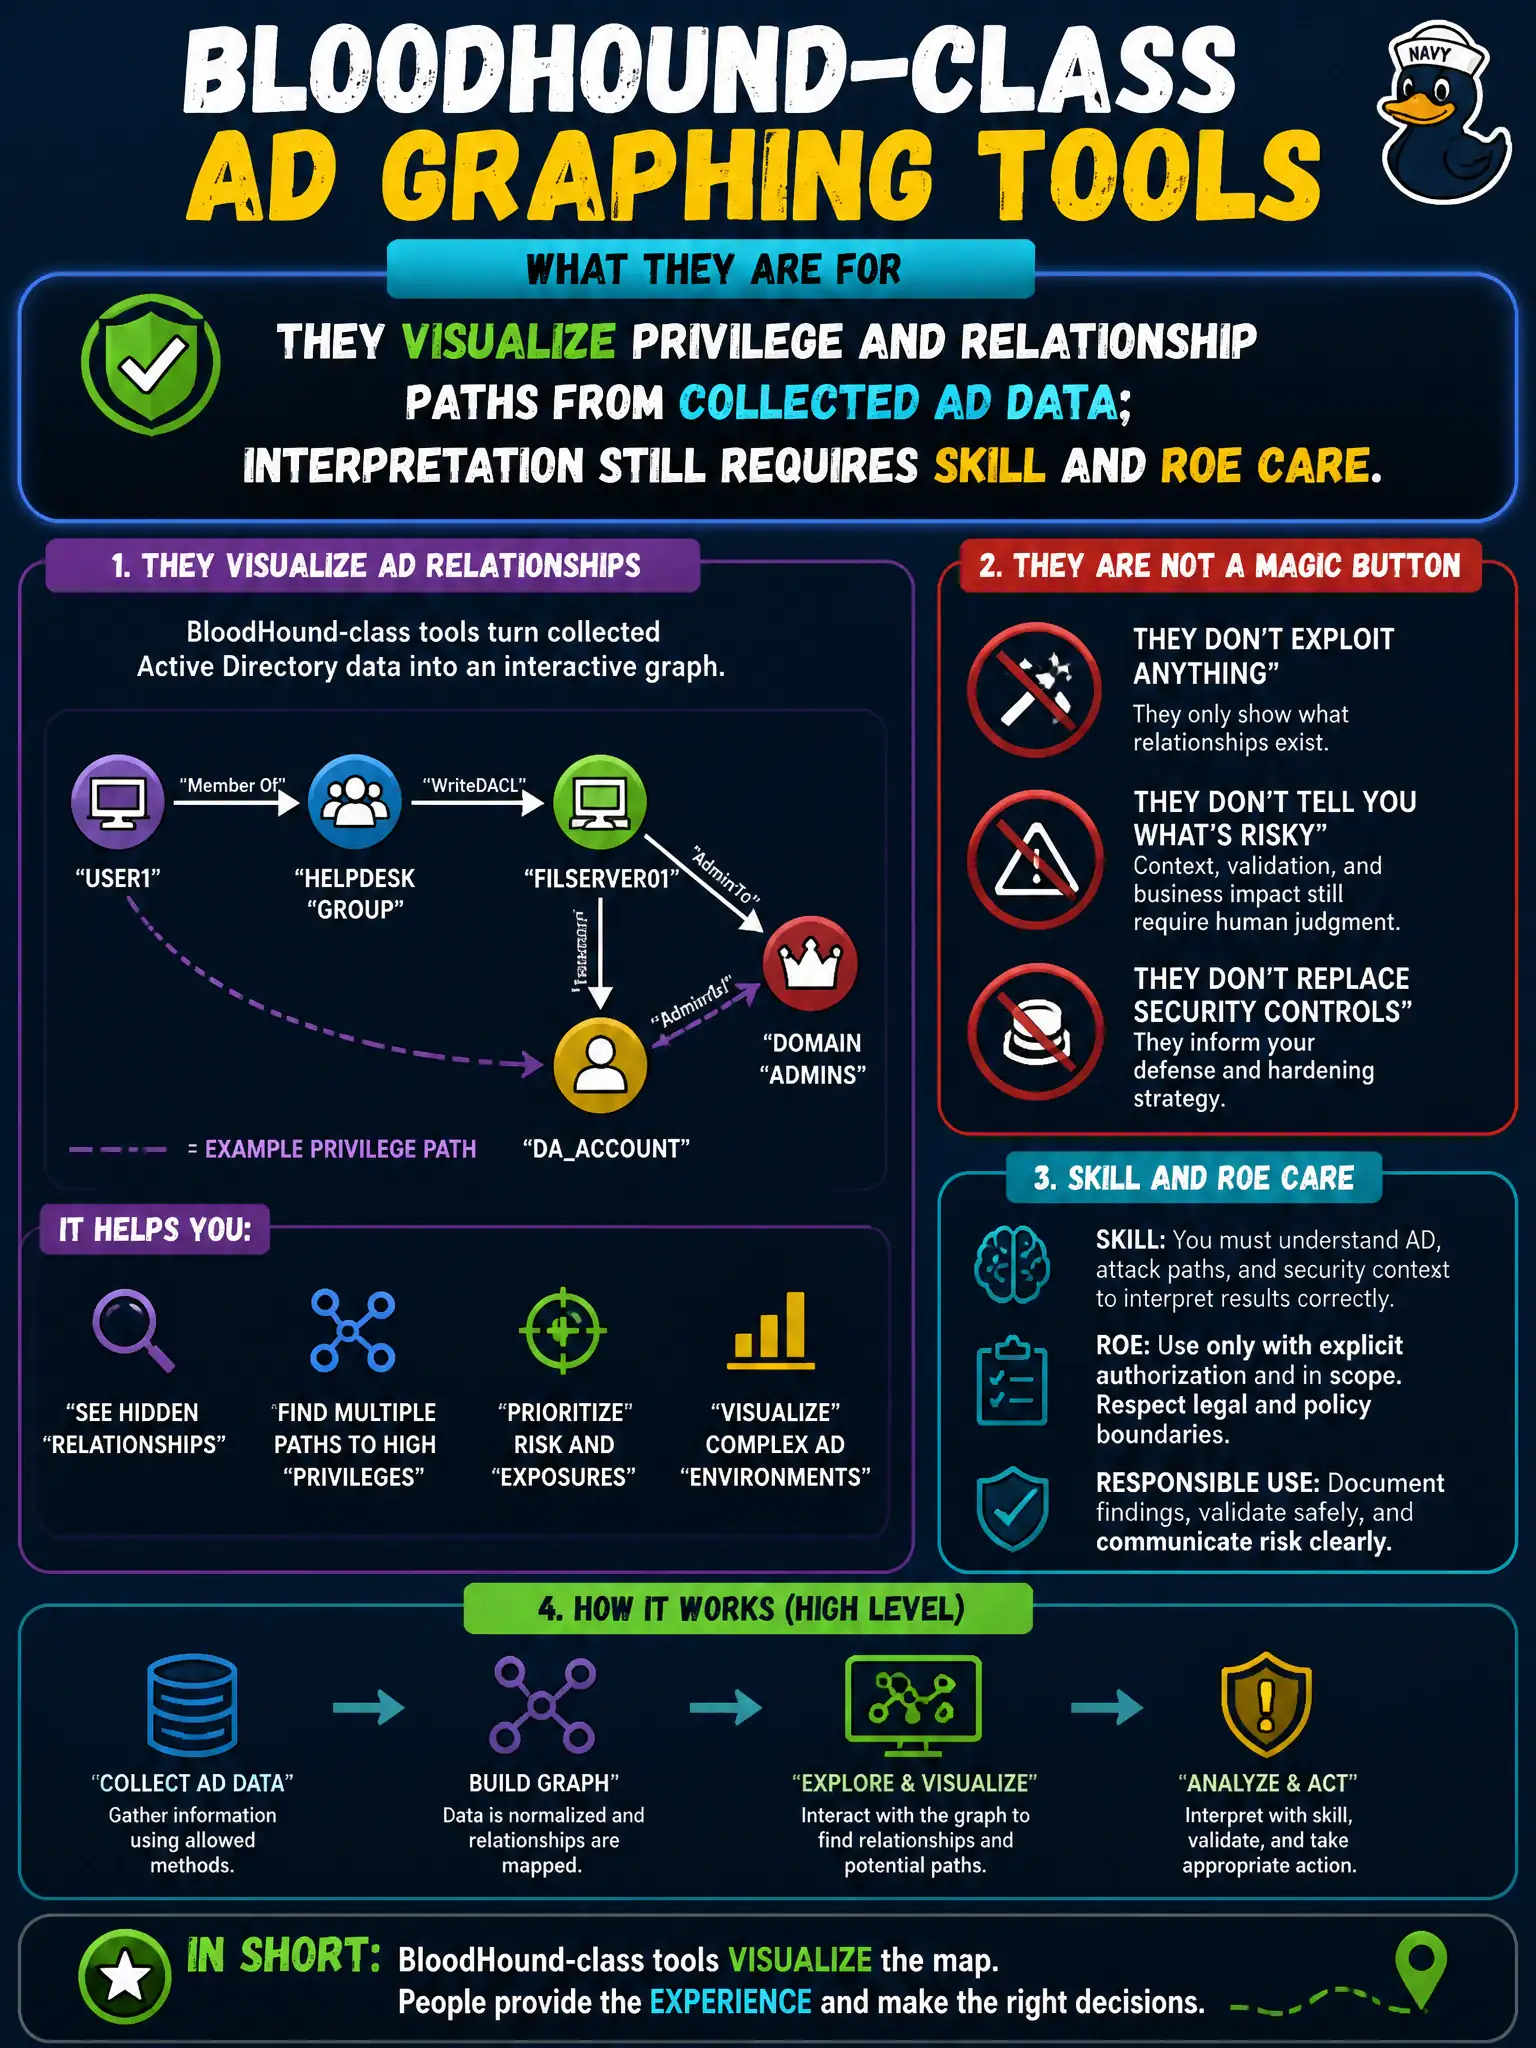
Think of graphing tools as a subway map of who can reach what in AD. The map does not ride the train for you — you still choose routes carefully and stay inside the RoE. Visualization aids judgment; it is not autopilot exploitation.
Full Explanation
When a city CISO asks what BloodHound-class AD graphing tools are for, the accurate explanation is that they visualize privilege and relationship paths from collected AD data; interpretation still requires skill and RoE care. They do not replace human analysis by automatically exploiting every displayed path. They are not malware droppers that must never appear in an authorized assessment when RoE permits their use. They also do more than inventory printer MAC addresses—they show group and privilege relationships. Exam caveat: graphing aids analysis; it does not grant automatic exploitation rights or remove ethics. Operational check: collect data only within scope, analyze highest-risk paths to crown jewels, validate findings manually, and avoid chasing every edge the graph renders without municipal business context. In municipal operations, record the rationale in the engagement notes so future testers and city defenders understand which approach was chosen and which failure modes the rejected options would create for civic services. Re-validate the same judgment after the next change window so the control still holds under the city’s current tooling, identity posture, and RoE amendments.