
A hospital briefing says average length of stay fell this quarter. Split by ward, surgical stays fell while intensive-care stays rose. What goes wrong when the briefing leads with only that average?
Select an answer to reveal the explanation.
Short Explanation
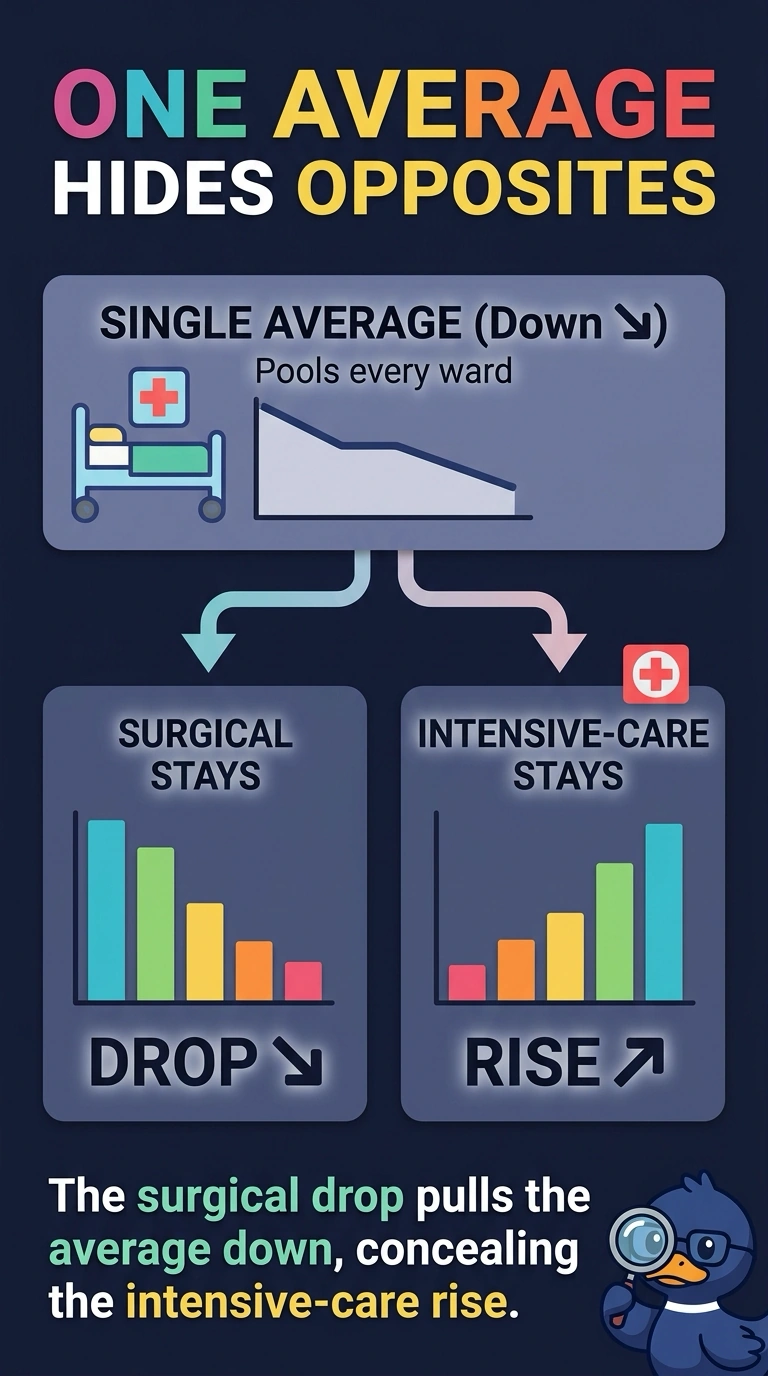
A school average can rise while one classroom is getting worse. You hid the intensive-care increase by leading with a single length-of-stay average. The trap is treating that average as proof that every ward moved the same way.
Full Explanation
A single aggregate can move one way while a subgroup moves the other way, and the aggregate hides that subgroup. Surgical stays fell and intensive-care stays rose, yet the hospital-wide average fell, so leading with only the average conceals the intensive-care increase. A reader who sees only that drop can walk away thinking every ward improved, including intensive care, where stays actually lengthened. A vertical axis that starts near the data would exaggerate a small change in a chart, and the failure here is the missing ward split, not the axis origin. Drawing length of stay and staffing on two axes would invite a comparison the scales do not support, which this briefing does not do. Keeping only the weeks that fit a falling story would cherry-pick the calendar, whereas the problem is pooling wards that did not move together. Exam caveat: the ward split has to be an operational grouping someone might act on, not an arbitrary cut searched until a reversal appears. Operational check: place the length-of-stay change for each ward beside the hospital average in the briefing packet before the average is quoted alone.