
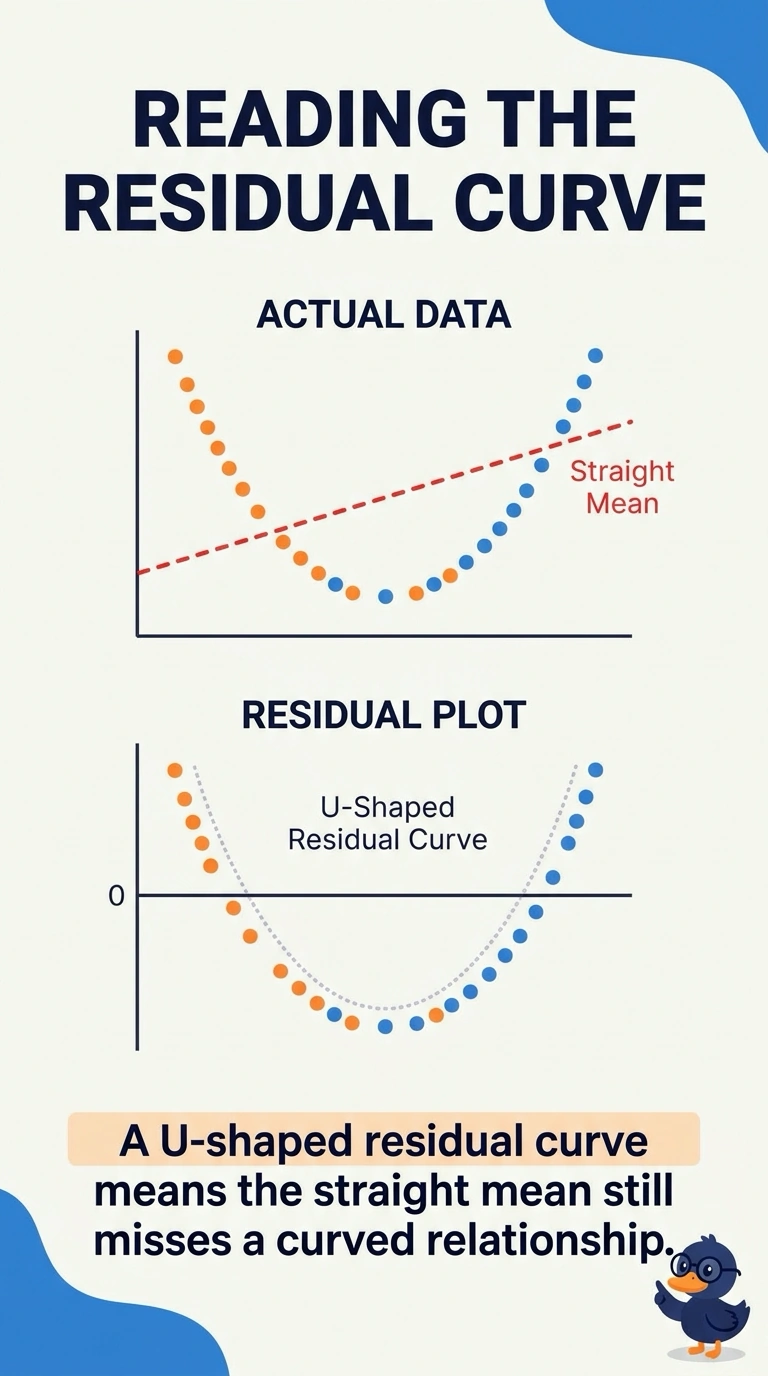
An agency fits a straight line relating case-processing days to case complexity, then plots residuals against complexity and sees a clear U-shaped curve. What does that curve mean?
Select an answer to reveal the explanation.
Short Explanation
A straight ruler laid across a bowl still leaves a curved gap. That U-shape means your line has not captured the mean, so complexity still needs a curved term. Do not blame a fan of spread or a couple of odd cases for a bend you can see through the middle.
Full Explanation
A residual is the observed processing time minus the straight-line prediction. If the mean were really a straight function of complexity, those residuals would scatter without a systematic curve. A clear U shape means the line is too low in one region and too high in another, so a curved function of complexity is still missing from the mean. Calling the plot pattern-free ignores the curve the team can see. A fan, where vertical spread grows with the fitted value while the center stays near zero, is a variance pattern, and it is not what a U-shaped center describes. Blaming only a handful of extremes fails when the bend runs through the body of the plot; a few points can tug a line, but a smooth U is structure in the mean, not a couple of stray cases. Exam caveat: look at where the curve sits; a bend in the center of the residual plot is about the mean, while a widening cloud at a flat center is about spread. Operational check: add a curved term in complexity, refit, and confirm the U in the residual plot flattens.