
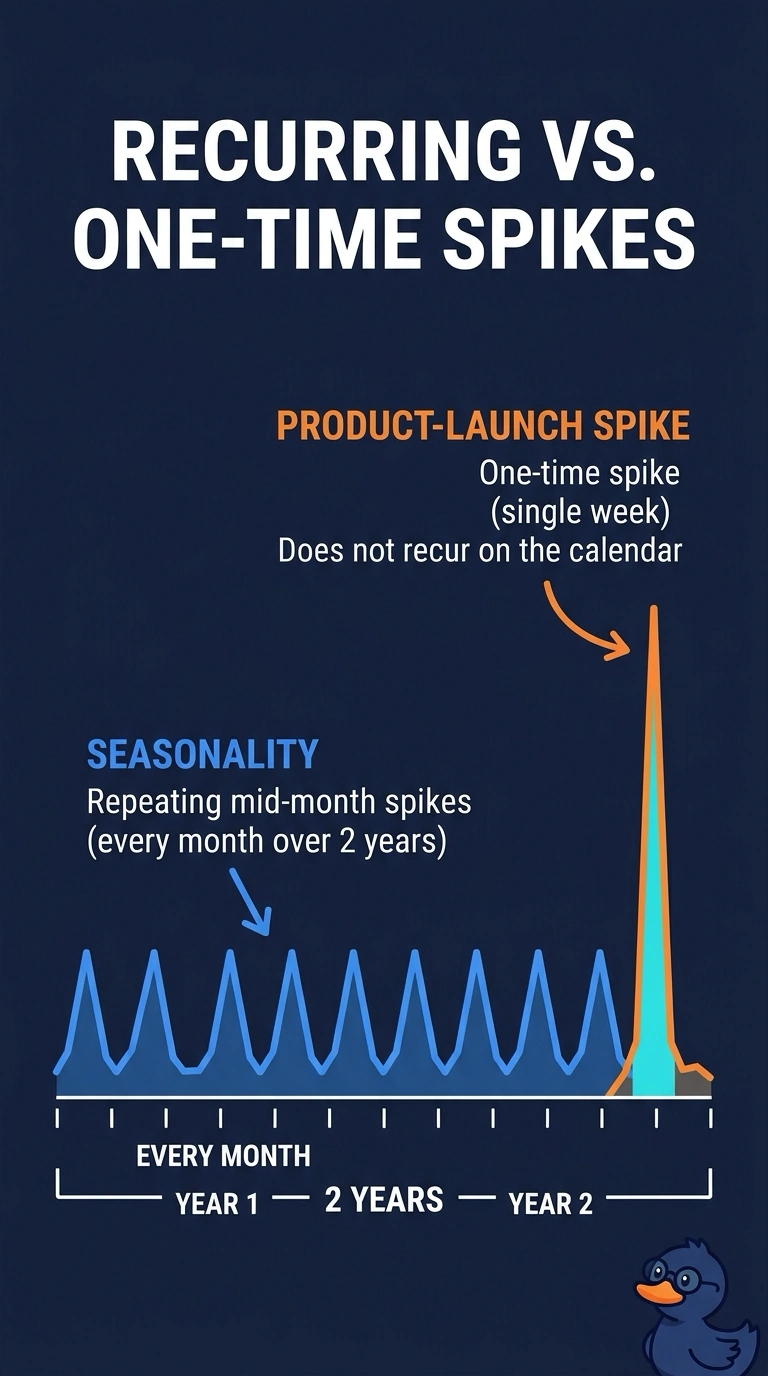
A bank fraud desk plots daily card disputes and sees the same mid-month spike in every month for two years, plus one extra spike in the single week a new card product launched. An analyst describes both shapes with one label. Which description separates them correctly?
Select an answer to reveal the explanation.
Short Explanation
A monthly bus that shows up on the same day is a schedule, while a parade that blocks the street once is not. Your mid-month dispute spike repeats on the calendar, so it is seasonality, and the product-launch spike is a one-time jump. The trap is giving both shapes the same name.
Full Explanation
Seasonality is a pattern that repeats on a calendar period, such as the same part of every month. The mid-month dispute spike appears in every month across two years, so it is a seasonal cycle. The product-launch spike occurs in one week and is not described as returning on later launches, so it is a one-time jump, not another seasonal cycle. Calling both shapes seasonality treats a single calendar coincidence as a repeating cycle. Calling both shapes one-time level shifts ignores that the mid-month spike has already repeated for two years. Long-run upward drift is a trend, not seasonality, and removing both spikes before looking at the calendar throws away the repeating pattern the plot actually shows. Exam caveat: a one-time jump can land on a calendar date without becoming seasonal; seasonality requires the pattern to recur at that period. Operational check: mark the mid-month spike on a month-of-year chart and confirm it returns each month, then mark the launch week and confirm it has no matching spike in other months.