
An auto-parts plant counts serious near-misses on one production line during each shift. Shifts are the same length, the events are uncommon, and there is no fixed number of chances inside a shift. Which distribution matches that count?
Select an answer to reveal the explanation.
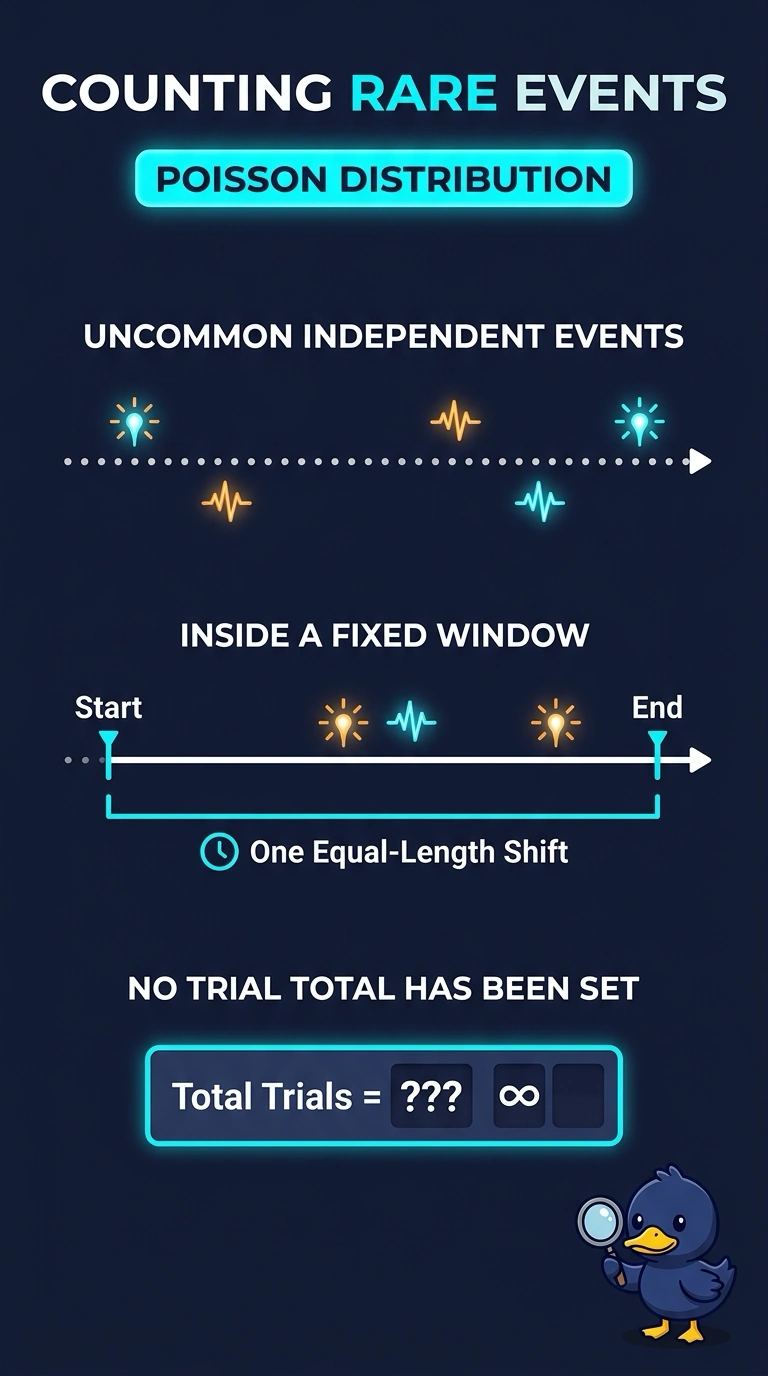
Short Explanation
A shift is like a fishing hour: you count the bites, and you do not have a fixed stack of coin flips. A Poisson distribution counts uncommon events inside that fixed window, which is the near-miss tally you were handed. The trap is the binomial, which needs a preset number of trials the plant does not have.
Full Explanation
A Poisson distribution models how many events occur in a fixed window of time or space when events are uncommon and arrive independently, without a preset number of trials. Each shift is the same length, near-misses are uncommon, and the plant has no fixed count of chances inside the shift, so the tally of near-misses is a Poisson count. A binomial distribution also produces a count, but only across a fixed number of independent yes-or-no trials, and this line has no such trial total. An exponential distribution describes the waiting time between events in the same kind of process, not the number of events that land inside the shift. A normal distribution describes a continuous, symmetric measurement and is the wrong shape for a small count of rare events. Exam caveat: when a window contains many opportunities and each is unlikely, a Poisson can approximate a binomial, but the process here has no fixed trial count, so the Poisson is the match. Operational check: confirm the table is one row per equal-length shift, the column is a count, and no denominator of possible chances is defined.